
May 2021 | Fixed Income Markets Review
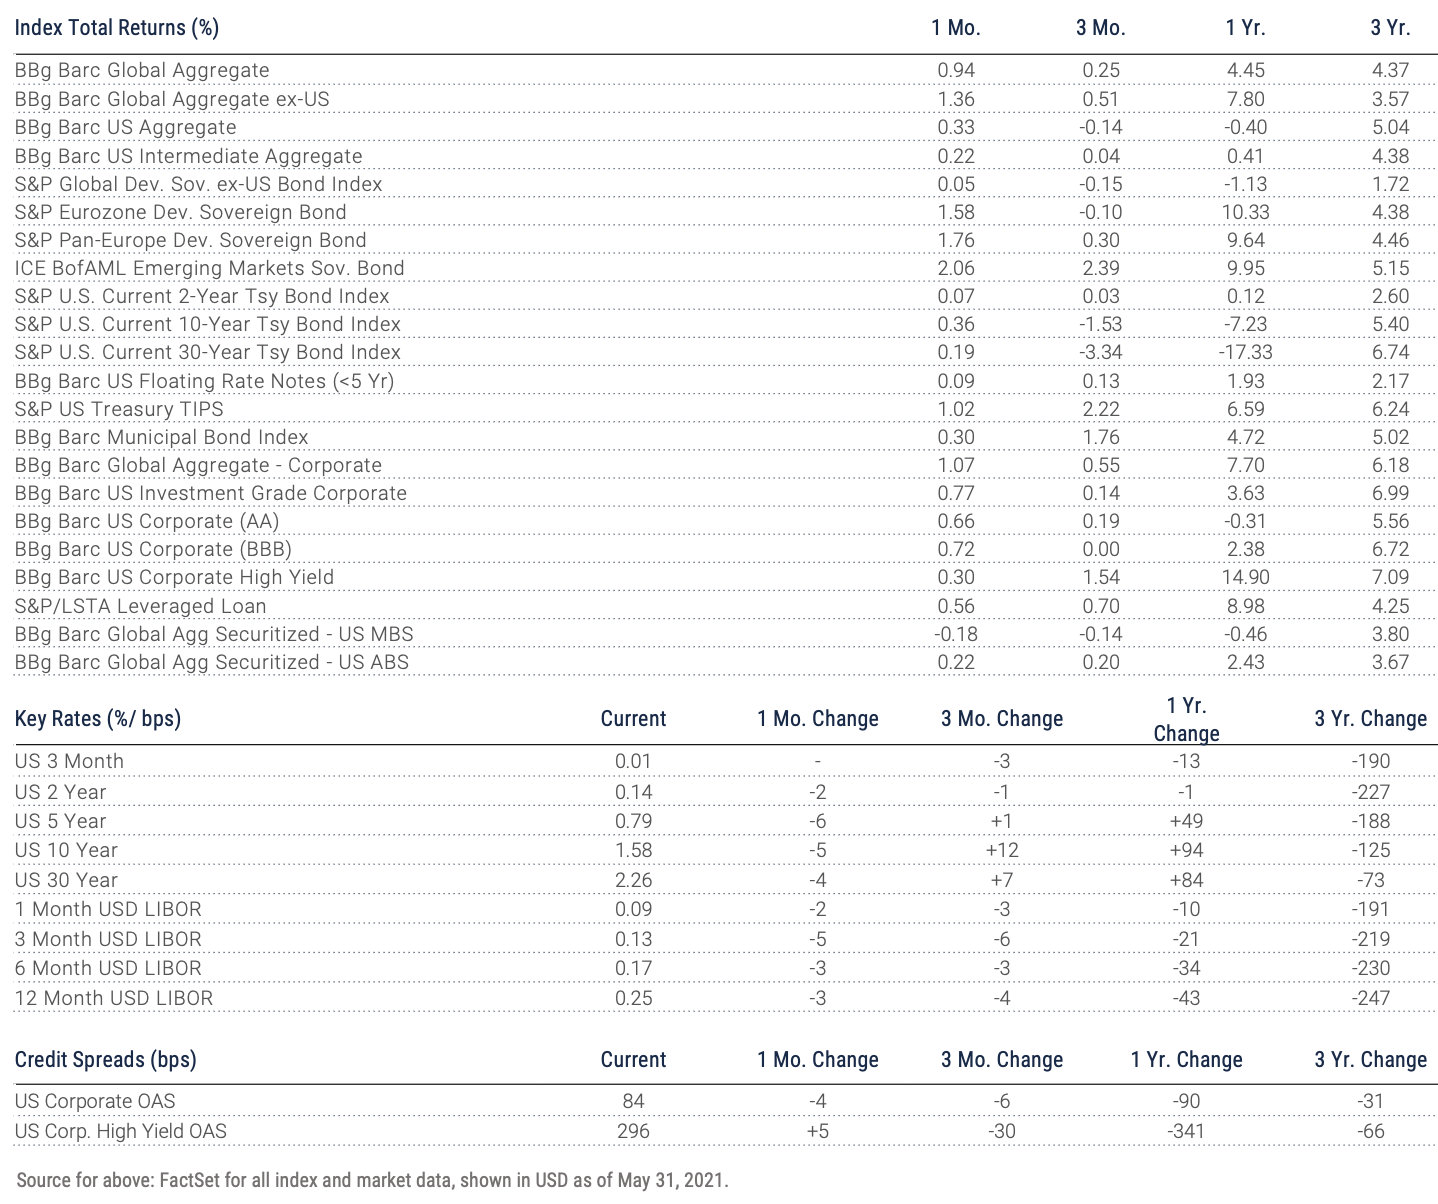
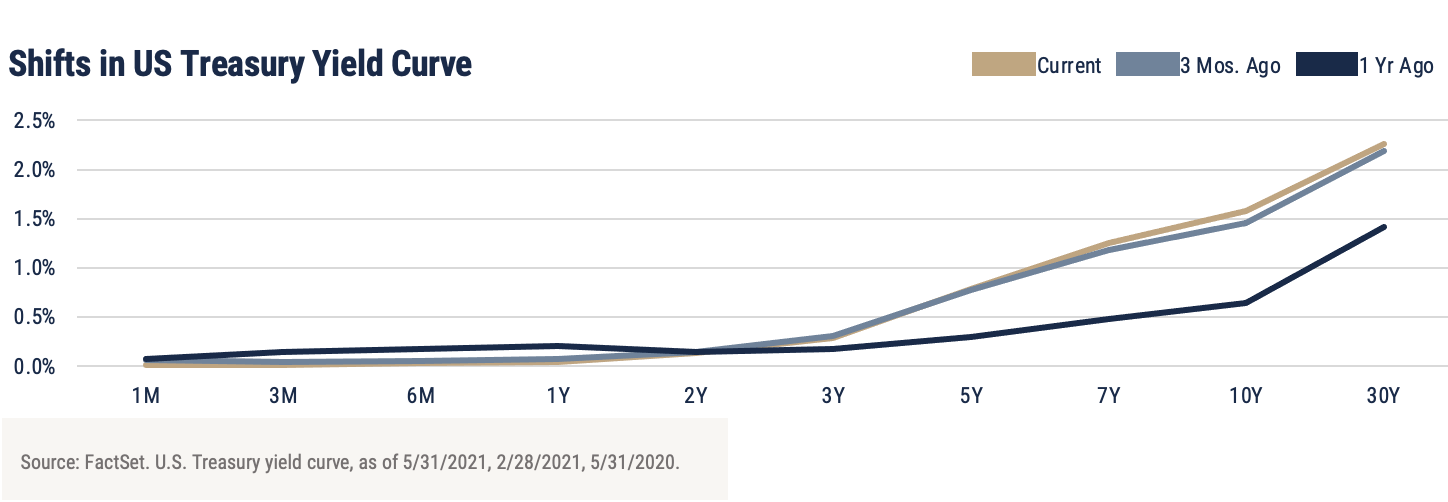
Fixed income returns were generally positive for May as long-term U.S. Treasury yields fell for the second straight month. Ten-year forward inflation expectations increased, albeit modestly, to 2.44%, which helped push down ten-year real yields to -0.86%. The Bloomberg Barclays U.S. Aggregate finished the month up 33 bps, bringing the year-to-date total return to -2.29%.
As the U.S. economy continues to recover from a decrease in economic growth due to COVID-19, the topic of forward inflation has been on the minds of consumers, businesses and market participants. Specifically, will the above-average inflation we have recently seen in goods and services continue for the foreseeable future? While there are plenty of conflicting answers to this question, the Federal Reserve has made it clear they will be patient and tolerate inflation above their two percent target to allow the U.S. economy to fully heal.
Before altering their current accommodative policy stance, the Fed will also need to see a tighter labor market. Without an increase in labor participation and a corresponding decrease in the unemployment rate, the Fed may have their hands tied as it relates to raising interest rates and tapering their $120 billion monthly asset purchase program. At the end of May, the U.S. labor force participation rate was still two percent below its January 2020 level. Additionally, the U-3 unemployment rate currently stands at 5.8%. According to current guidelines from the U.S. Government, additional unemployment benefits will end in September of this year. Some believe that this may force people back into the workforce, thus increasing the labor force participation rate. Should this happen, it is possible market participants may see inflation return to more average levels, as supply chain imbalances are alleviated.
While not an immediate threat to the national economy, rising debt levels in the U.S. may also give investors pause over their long-term interest rate outlook. Although any potential increase in taxes may increase government revenue, estimates from the Congressional Budget Office show an overall increase in debt over the next thirty years. Extrapolating off current and proposed spending, debt held by the public is estimated to reach 107% of GDP in 2031 and rise to 202% by 2051. Furthermore, interest expense as a percentage of GDP is expected to increase. Due to an increase in the level of debt, there is the possibility that borrowing costs may increase as investors demand higher yields over concerns regarding the government’s fiscal position. However, one may also make the argument the Federal Reserve will need to keep rates at historically low levels. By doing so, the government could enact its fiscal spending policies without exponentially increasing the risk of a fiscal crisis.
Important Notes & Disclosures
Index Returns – all shown in US dollars
All returns shown trailing 5/31/2021 for the period indicated. “YTD” refers to the total return as of prior-year end, while the other returns are annualized. 3-month and annualized returns are shown for:
- The Barclay’s US Aggregate Index, a broad-based unmanaged bond index that is generally considered to be representative of the performance of the investment grade, US dollar-denominated, fixed-rate taxable bond market.
- The ICE BofAML Emerging Markets Sovereign Bond Index is a subset of The BofA Merrill Lynch World Sovereign Bond Index excluding all securities with a country of risk that is a member of the FX G10, all Western European countries, and territories of the U.S. and Western European countries. The FX G10 includes all Euro members, the U.S., Japan, the U.K., Canada, Australia, New Zealand, Switzerland, Norway, and Sweden.
- The Bloomberg Barclays Global Aggregate Index, which measures global investment grade debt from twenty-four local currency markets. This multi-currency benchmark includes treasury, government-related, corporate and securitized fixed-rate bonds from both developed and emerging markets issuers.
- The S&P Global Developed Sovereign Bond index includes local-currency denominated debt publicly issued by governments in their domestic markets.
- S&P Eurozone Developed Sovereign Bond - seeks to measure the performance of Eurozone government bonds.
- The S&P Pan-Europe Developed Sovereign Bond Index is a comprehensive, market-value-weighted index designed to track the performance of local currency-denominated securities publicly issued by Denmark, Norway, Sweden, Switzerland, the U.K. and developed countries in the Eurozone for their domestic markets.
- ICE BofAML Emerging Markets Sovereign Bond - tracks the performance of US dollar (USD) and Euro denominated emerging markets non-sovereign debt publicly issued within the major domestic and Eurobond markets.
- The Bloomberg Barclay’s US Corporate Bond Index (AA), which measures the investment grade, fixed-rate, taxable corporate bond market. It includes USD denominated securities publicly issued by US and non-US industrial, utility and financial issuers.
- The Bloomberg Barclay’s US Corporate High Yield Index, which covers the USD-denominated, non-investment grade, fixed-rate, taxable corporate bond market.
- Bloomberg Barclay’s Global Aggregate Securitized- US Mortgage-Backed Securities, which is a component of the Bloomberg Barclay’s US Aggregate Index and measures investment grade mortgage backed pass-through securities of GNMA, FNMA, and FHLMC.
- Bloomberg Barclay’s Global Aggregate Securitized- US Asset-Backed Securities, which is a component of the Bloomberg Barclay’s US Aggregate Index and includes the pass-throughs, bullets, and controlled amortization structures of only the senior class of ABS issues.
- The Blomberg Barclay’s US Floating Rate Notes (<5 Yr) Index, measures the performance of U.S dollar-dominated, investment grade floating rate notes with maturities less than 5 years.
- The Bloomberg Barclay’s Municipal Bond Index, which measures investment grade, tax-exempt bonds with a maturity of at least one year.
- The S&P/ LSTA Leveraged Loan Index is designed to reflect the performance of the largest facilities in the leveraged loan market.
An index is a portfolio of specific securities, the performance of which is often used as a benchmark in judging the relative performance to certain asset classes. Index performance used throughout is intended to illustrate historical market trends and performance. Indexes are managed and do not incur investment management fees. An investor is unable to invest in an index. Their performance does not reflect the expenses associated with the management of an actual portfolio. No strategy assures success or protects against loss. There is no guarantee that a diversified portfolio will enhance overall returns or outperform a non-diversified portfolio. Diversification does not protect against market risk. All investing involves risk including loss of principal. Investing in stock includes numerous specific risks including: the fluctuation of dividend, loss of principal, and potential liquidity of the investment in a falling market. Past performance is no guarantee of future results.
Key Rates
Key Rates are shown for US Treasuries and London Interbank Offered Rate (LIBOR), the interest rate at which banks offer to lend funds (wholesale money) to one another in the international interbank market. LIBOR is a key benchmark rate that reflects how much it costs banks to borrow from each other. “Current” refers to the percentage rate as of 6/30/2018, while the rates of change are stated in basis points.
Credit Spreads
Credit Spreads shown comprise the Option-Adjusted Spread of the indices indicated, versus the US 10-Year Treasury Yield. “Current” refers to the spread as of 6/30/2018, while the rates of change are stated in basis points.
Key Indicators
Key Indicators correspond to various macro-economic and rate-related data points that we consider impactful to fixed income markets.
- 2s10s (bps)/ 10 Yr vs 2 Yr Treasury Spread, which measures the difference between yields on 10-Year Treasury Constant Maturity Securities and 2-Year Treasury Constant Maturity Securities.
- West Texas Intermediate, which is an oil benchmark and the underlying asset in the New York Mercantile Exchange’s oil futures contract.
- Core Consumer Price Index, which measures the consumer price index excluding food and energy prices. Shown as of the prior month-end.
- Breakeven Inflation: 5 Yr %/ bps, which uses a moving 30-day average of the 5-Year Treasury Constant Maturity Securities and 5-Year Treasury Inflation–Indexed Constant Maturity Securities to derive expected inflation.
- Breakeven Inflation: 10 Yr %/ bps, which uses a moving 30-day average of the 10-Year Treasury Constant Maturity Securities and 10-Year Treasury Inflation–Indexed Constant Maturity Securities to derive expected inflation.
General Disclosure
Wilbanks, Smith & Thomas Asset Management (WST) is an investment adviser registered under the Investment Advisers Act of 1940. Registration as an investment adviser does not imply any level of skill or training. The information presented in the material is general in nature and is not designed to address your investment objectives, financial situation or particular needs. Prior to making any investment decision, you should assess, or seek advice from a professional regarding whether any particular transaction is relevant or appropriate to your individual circumstances. This material is not intended to replace the advice of a qualified tax advisor, attorney, or accountant. Consultation with the appropriate professional should be done before any financial commitments regarding the issues related to the situation are made.
This document is intended for informational purposes only and should not be otherwise disseminated to other third parties. Past performance or results should not be taken as an indication or guarantee of future performance or results, and no representation or warranty, express or implied is made regarding future performance or results. This document does not constitute an offer to sell, or a solicitation of an offer to purchase, any security, future or other financial instrument or product. This material is proprietary and being provided on a confidential basis, and may not be reproduced, transferred or distributed in any form without prior written permission from WST. WST reserves the right at any time and without notice to change, amend, or cease publication of the information. The information contained herein includes information that has been obtained from third party sources and has not been independently verified. It is made available on an "as is" basis without warranty and does not represent the performance of any specific investment strategy.
Some of the information enclosed may represent opinions of WST and are subject to change from time to time and do not constitute a recommendation to purchase and sale any security nor to engage in any particular investment strategy. The information contained herein has been obtained from sources believed to be reliable but cannot be guaranteed for accuracy.
Besides attributed information, this material is proprietary and may not be reproduced, transferred or distributed in any form without prior written permission from WST. WST reserves the right at any time and without notice to change, amend, or cease publication of the information. This material has been prepared solely for informative purposes. The information contained herein may include information that has been obtained from third party sources and has not been independently verified. It is made available on an “as is” basis without warranty. This document is intended for clients for informational purposes only and should not be otherwise disseminated to other third parties. Past performance or results should not be taken as an indication or guarantee of future performance or results, and no representation or warranty, express or implied is made regarding future performance or results. This document does not constitute an offer to sell, or a solicitation of an offer to purchase, any security, future or other financial instrument or product.