
October 2019 - Global Equity Market Review
In October risk-asset investors welcomed a relaxation of geopolitical rifts that have discouraged positive conviction and clouded the global growth outlook, which does remain soft despite the positive turn in equity investor sentiment. Global stocks, as measured by the MSCI ACWI, added 2.8% in USD terms (2.0% in local currency).
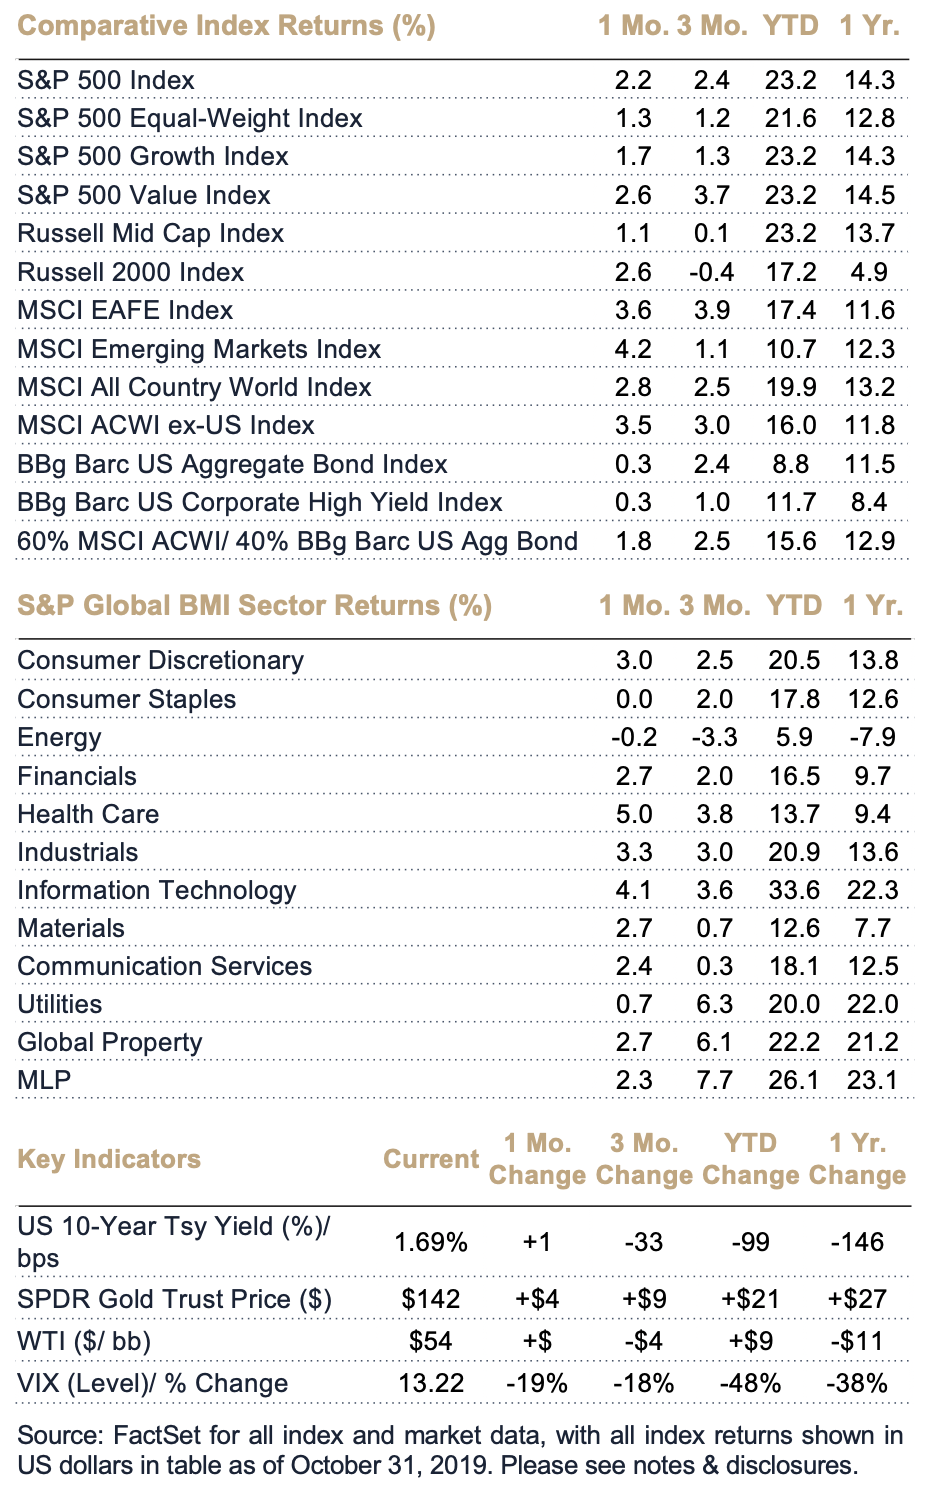
US equity (+2.2%) ceded to the MSCI EAFE a long-held pole position for trailing 90-day returns, but as a positive indicator of breadth the month steepened the recent performance advantage of several disfavored domestic equity segments. While, interestingly, the S&P 500 Equal-Weight Index (+1.3%) lagged the cap-weighted index, the month saw strength in the two factors that typically drive positive excess return for equal-weight; i.e., a value bias and a lower market-cap profile (relative to a cap-weighted indexed dominated by large growth names). This dynamic was attributable largely to strong results for large US health care names and a seemingly narrow rally in small cap. With a return of 2.6% for the month the S&P 500 Value handily topped growth names (+1.7%) and enjoys a nearly 250-basis point advantage over the trailing three month period, while small caps (+2.6% for October as measured by the Russell 2000) remain in the red for the trailing 90-day period. Interestingly, the S&P 500 Growth, S&P 500 Value and Russell Mid Cap Index each have posted 23.2% in year-to-date gains – on par exactly with the S&P 500 Index.
The month’s outcome was driven primarily by a promising shift in tone surrounding US-China trade hostilities.
President Trump’s enunciation of a “Phase One Trade Deal” (a provisional plan mapping out, among other terms, increased purchase of US agricultural products by China) green-lit a substantial, market-leading rally in emerging markets equities (+4.2% in USD terms, +3.0% in local currency). Longer-dated US Treasuries backed up on a combination of good news for equities but also as (albeit mixed, with some positives) US economic data evidenced some early run-off in consumer confidence. The UK, meanwhile, managed again to dodge a no-deal Brexit scenario, rallying the pound. The US dollar slipped substantially against the pound and solidly versus the Euro. Emerging markets currencies saw mixed results; struggles continued for 2019’s “crisis currencies” – the Turkish lira and Argentine peso – with the former dogged by US foreign policy headlines and inflation weighing on the latter. Led by China, however, export-heavy developing Asian economies saw their currencies buoyed by positive direction on trade.
With the exception of Energy (ultimately flat alongside oil prices) all global sectors were positive, with Health Care and Technology leading. Utilities – a rate-sensitive sector that has enjoyed unusual strength in 2019, given bouts of high volatility and an increasingly negative yield landscape – moved positively but moderately, while the Consumer Staples sector was flat given the risk-on mood in equity markets.
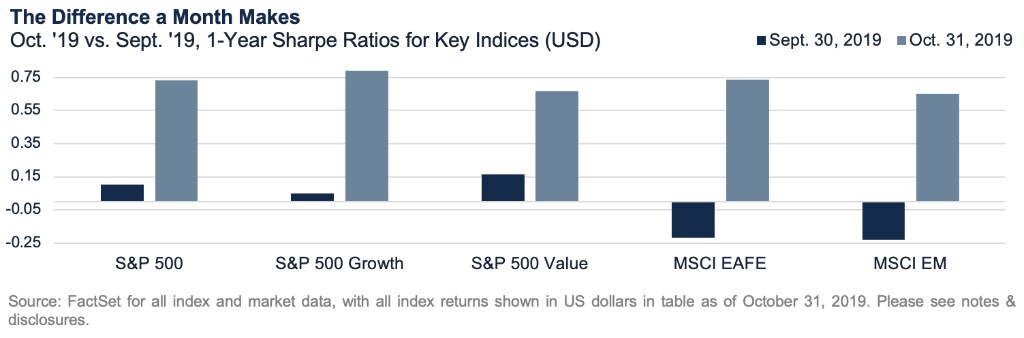
As shown below, the one-year Sharpe ratios ended September 30 versus October 31 tell vastly different stories about recent risk-adjusted performance across key indices. Both figures capture the December 2018 sell-off and participation in the 20%+ rally since 4Q 2018. The comparison evidences, however, the outsized impact of the October 2018 sell-off on risk-adjusted return and underscores the nearly 40% year-over-year retreat of volatility as measured by the VIX, or so-called “Fear Index.”
Notes & Disclosures
Index Returns – all shown in US dollars
All returns shown trailing 10/31/2019 for the period indicated. “YTD” refers to the total return as of prior-year end, while the other returns are annualized. 3-month and annualized returns are shown for:
- The S&P 500 index is comprised of large capitalized companies across many sectors and is generally regarded as representative of US stock market and is provided in this presentation in that regard only.
- The S&P 500® Equal Weight Index (EWI) is the equal-weight version of the widely-used S&P 500. The index includes the same constituents as the capitalization weighted S&P 500, but each company in the S&P 500 EWI is allocated a fixed weight - or 0.2% of the index total at each quarterly rebalance. The S&P 500 equal-weight index (S&P 500 EWI) series imposes equal weights on the index constituents included in the S&P 500 that are classified in the respective GICS® sector.
- The S&P 500 Growth Index is comprised of equities from the S&P 500 that exhibit strong growth characteristics and is weighted by market-capitalization.
- The S&P 500 Value Index is a market-capitalization weighted index comprising of equities from the S&P 500 that exhibit strong value characteristics such as book value to price ratio, cash flow to price ratio, sales to price ratio, and dividend yield.
- The Russell 3000 Index tracks the performance of 3000 U.S. corporations, determined by market-capitalization, and represents 98% of the investable equity market in the United States.
- The Russell Mid Cap Index measures the mid-cap segment performance of the U.S. equity market and is comprised of approximately 800 of the smallest securities based on current index membership and their market capitalization.
- The Russell 2000 Index is a market-capitalization weighted index that measures the performance of 2000 small-cap and mid-cap securities. The index was formulated to give investors an unbiased collection of the smallest tradable equities still meeting exchange listing requirements.
- The MSCI All Country World Index provides a measure of performance for the equity market throughout the world and is a free float-adjusted market capitalization weighted index.
- The MSCI EAFE Index is a market-capitalization weighted index and tracks the performance of small to large-cap equities in developed markets of Europe, Australasia, and the Far East.
- The MSCI Emerging Markets Index is a float-adjusted market-capitalization index that measures equity market performance in global emerging markets and cannot be purchased directly by investors.
- The S&P Global BMI sector indices are into sectors as defined by the widely used Global Industry Classification Standards (GICS) classifications. Each sector index comprises those companies included in the S&P Global BMI that are classified as members of respective GICS® sector. The S&P Global BMI Indices were introduced to provide a comprehensive benchmarking system for global equity investors. The S&P Global BMI is comprised of the S&P Emerging BMI and the S&P Developed BMI. It covers approximately 10,000 companies in 46 countries. To be considered for inclusion in the index, all listed stocks within the constituent country must have a float market capitalization of at least $100 million. For a country to be admitted, it must be politically stable and have legal property rights and procedures, among other criteria.
- The Barclay’s US Aggregate Index, a broad based unmanaged bond index that is generally considered to be representative of the performance of the investment grade, US dollar-denominated, fixed-rate taxable bond market.
- The Bloomberg Barclay’s US Corporate High Yield Index, which covers the USD-denominated, non-investment grade, fixed-rate, taxable corporate bond market.
Key Indicators
Key Indicators correspond to various macro-economic and rate-related data points that we consider impactful to equity markets.
- The US 10-Year Treasury Yield (%)/bps, is the return on investment for the U.S. government’s 10-year debt obligation and serves as a signal for investor confidence.
- SPDR Gold Trust Price ($), is an investment fund that reflects the performance on the price of a gold bullion, less the Trust’s expenses.
- West Texas Intermediate, which is an oil benchmark and the underlying asset in the New York Mercantile Exchange’s oil futures contract.
- CBOE Volatility Index (Level)/% Change, which uses price options on the S&P 500 to estimate the market's expectation of 30-day volatility.
This document is intended for informational purposes only and should not be otherwise disseminated to other third parties. Past performance or results should not be taken as an indication or guarantee of future performance or results, and no representation or warranty, express or implied is made regarding future performance or results. This document does not constitute an offer to sell, or a solicitation of an offer to purchase, any security, future or other financial instrument or product. This material is proprietary and being provided on a confidential basis, and may not be reproduced, transferred or distributed in any form without prior written permission from WST. WST reserves the right at any time and without notice to change, amend, or cease publication of the information. This material has been prepared solely for informative purposes. The information contained herein includes information that has been obtained from third party sources and has not been independently verified. It is made available on an "as is" basis without warranty and does not represent the performance of any specific investment strategy.
We consider an index to be a portfolio of securities whose composition and proportions are derived from a rules-based model. See the appropriate disclosures regarding models, indices and the related performance. You cannot invest directly in an index and the performance of an index does not represent the performance of any specific investment. Some of the information enclosed may represent opinions of WST and are subject to change from time to time and do not constitute a recommendation to purchase and sale any security nor to engage in any particular investment strategy.
Past performance or results should not be taken as an indication or guarantee of future performance or results, and no representation or warranty, express or implied is made regarding future performance or results.
Besides attributed information, this material is proprietary and may not be reproduced, transferred or distributed in any form without prior written permission from WST. WST reserves the right at any time and without notice to change, amend, or cease publication of the information. This material has been prepared solely for informative purposes. The information contained herein may include information that has been obtained from third party sources and has not been independently verified. It is made available on an “as is” basis without warranty. This document is intended for clients for informational purposes only and should not be otherwise disseminated to other third parties. Past performance or results should not be taken as an indication or guarantee of future performance or results, and no representation or warranty, express or implied is made regarding future performance or results. This document does not constitute an offer to sell, or a solicitation of an offer to purchase, any security, future or other financial instrument or product.