
March 2020: Global Equity Market Review
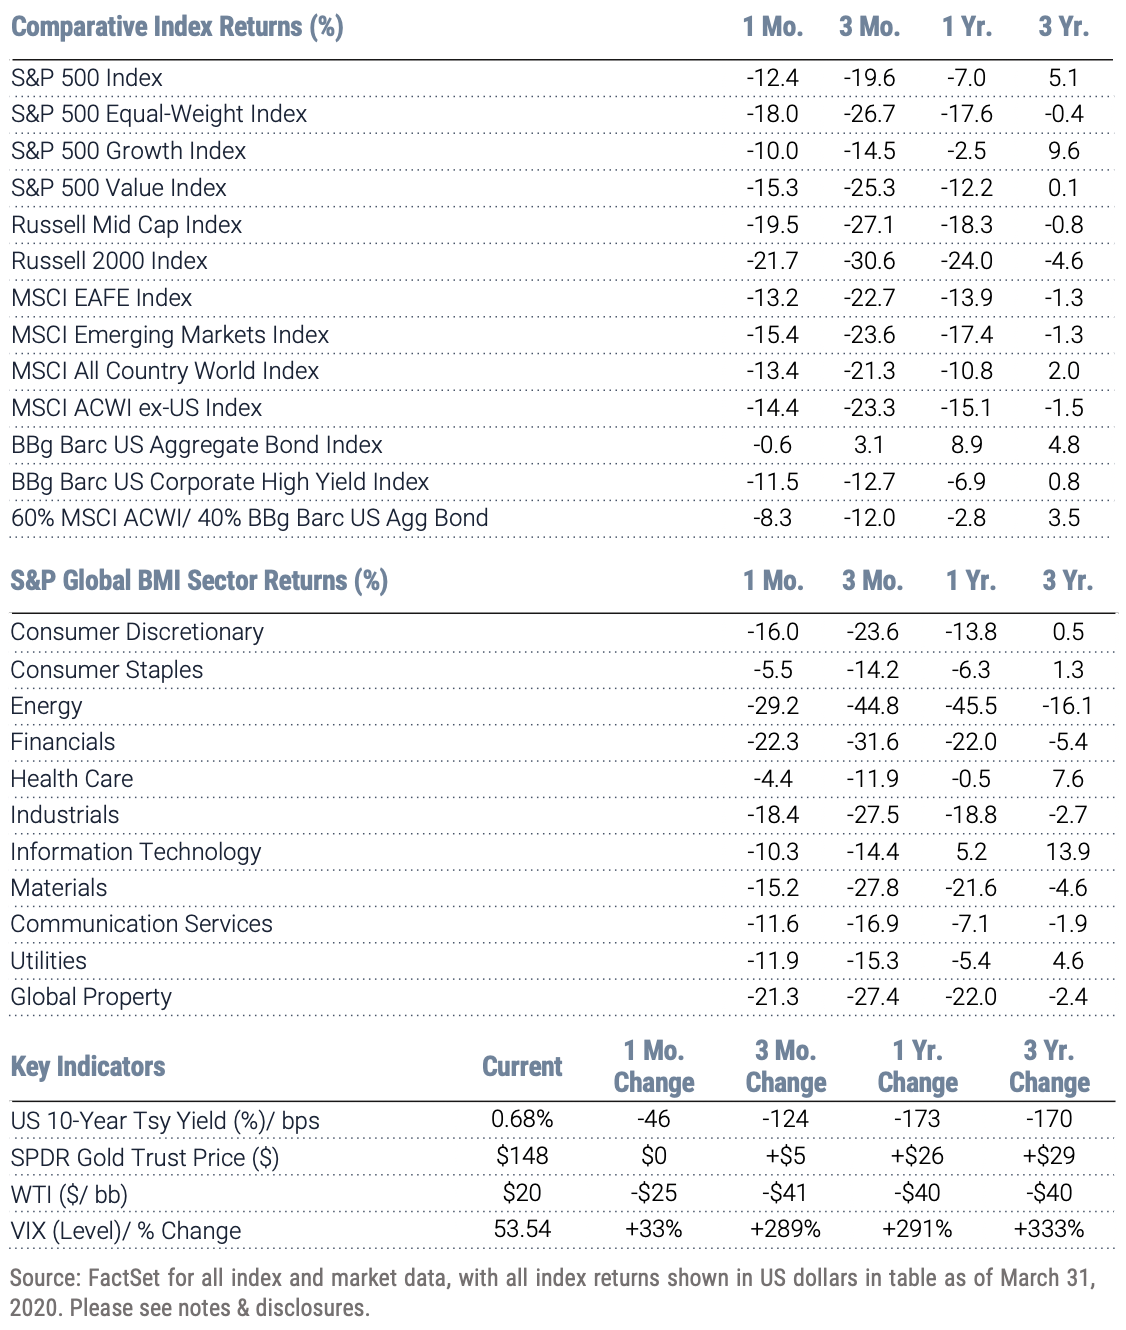
March, falling short of "madness", witnessed record setting declines across global equity markets, leaving equity investors with vastly different sentiment than at the beginning of 1Q. The S&P 500 decline of 12.4% was the fourth largest monthly decline in the past 75 years and the steepest drop since October 2008. The S&P 500 Growth was a top performer over the first quarter, continuing its outperformance and besting the S&P 500 Value by 10.8% in 1Q. Global equities, as measured by the MSCI ACWI, returned -13.4% and -21.3% in March and 1Q, respectively, as the ripple effects of the Covid-19 forced sell-offs in markets around the world. The downturn was magnified in non-U.S. indexes and eclipsed 20% down or more in small cap indexes across the globe in March.
Despite the uniqueness of the stock market decline being associated with a global pandemic, there is one constant quotient in all stock market cycles and that is human nature. It is an axiom in our business that it is possible to control risk but not uncertainty. As of this writing it remains uncertain the extent of the virus’s impact on our health and the economy. What we do know however, is the stimulus provided by monetary and fiscal authorities in the U.S. and elsewhere is unprecedented and should provide meaningful downside protection in all but the bleakest of forecasts.
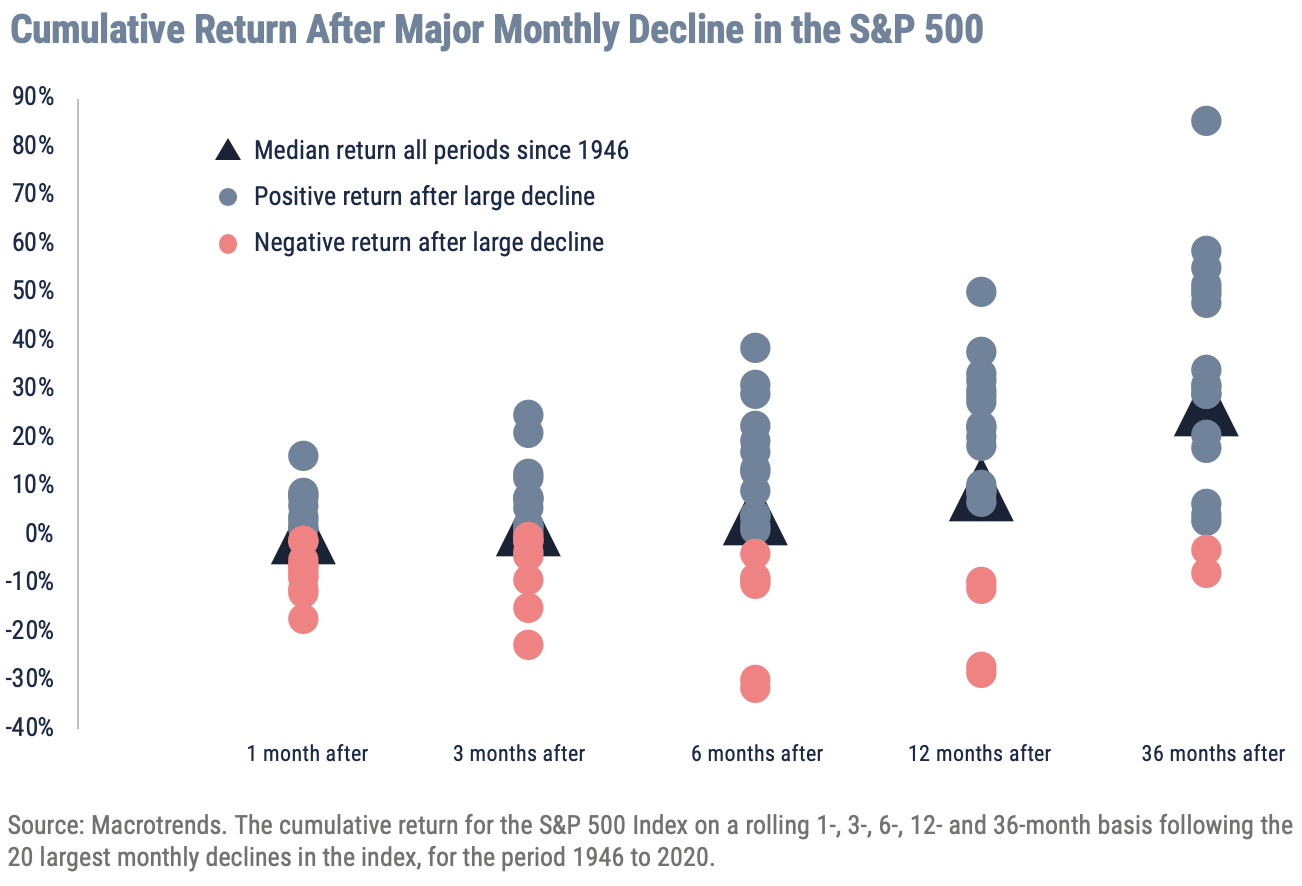
Given our positive view of the indomitable strength of the American spirit, we thought it instructive to gauge the behavior of markets after the major decline we saw last month. The Cumulative Return graph below illustrates the price return of the S&P 500 following the 20 biggest monthly declines since 1946 when viewed over 1-, 3-, 6-, 12- and 36-month periods. Two observations are worth noting. One is the return over the following 1 and 3 months remains unpredictable as the market digests the sharply lower repricing of stocks. However, it is also apparent from this analysis the longer the time horizon the more likely returns are not just positive but also above the median of stock market returns over all periods. The sharp downward spike in not just prices but also valuations, combined with any good news on the pandemic, suggests to us history will be a useful guide for the future. The waiting is often the hardest part but also more frequently the most rewarding.
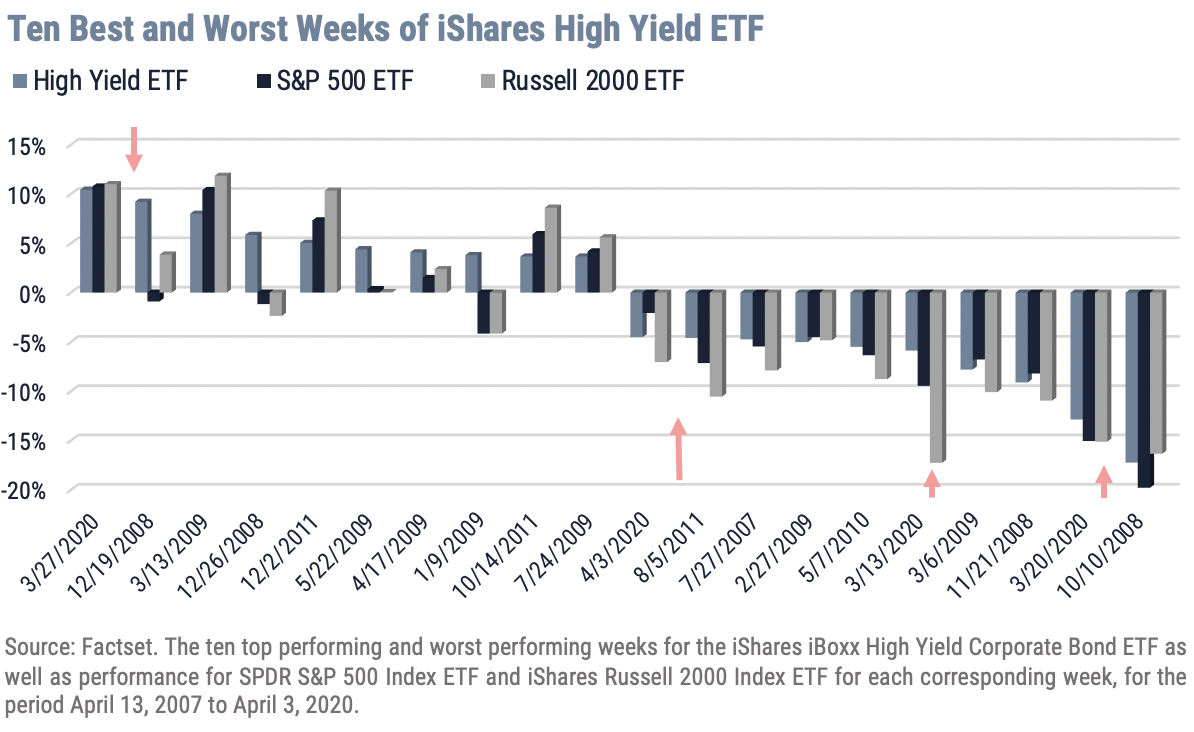
The intersection of stock and bond markets can often be seen in high yield credit which also suffered in the sell-offs last month. The connection is logical especially if investors are worried about credit risk in an uncertain economic environment. Four of the largest weekly changes in the iShares High Yield Index Bond ETF since 2007 occurred last month (1 positive/ 3 negative) as investors saw similar movements in stock indices. The chart below highlights the return pattern of large-cap and small-cap stocks during the ten best and worst weeks of the iShares High Yield Bond ETF since 2007. The pattern is most evident when high yield bonds are most under pressure as they were in March. The message is clear and an important reason why the Federal Reserve stepped in last month and began buying investment grade bonds and ETFs for the first time in its history. At this point in the market and economic cycle, stocks and high yield bonds will be highly correlated.
Important Disclosures
Index Returns – all shown in US dollars
All returns shown trailing 3/31/2020 for the period indicated. “YTD” refers to the total return as of prior-year end, while the other returns are annualized. 3-month and annualized returns are shown for:
- The S&P 500 index is comprised of large capitalized companies across many sectors and is generally regarded as representative of US stock market and is provided in this presentation in that regard only.
- The S&P 500® Equal Weight Index (EWI) is the equal-weight version of the widely-used S&P 500. The index includes the same constituents as the capitalization weighted S&P 500, but each company in the S&P 500 EWI is allocated a fixed weight - or 0.2% of the index total at each quarterly rebalance. The S&P 500 equal-weight index (S&P 500 EWI) series imposes equal weights on the index constituents included in the S&P 500 that are classified in the respective GICS® sector.
- The S&P 500 Growth Index is comprised of equities from the S&P 500 that exhibit strong growth characteristics and is weighted by market-capitalization.
- The S&P 500 Value Index is a market-capitalization weighted index comprising of equities from the S&P 500 that exhibit strong value characteristics such as book value to price ratio, cash flow to price ratio, sales to price ratio, and dividend yield.
- The Russell 3000 Index tracks the performance of 3000 U.S. corporations, determined by market-capitalization, and represents 98% of the investable equity market in the United States.
- The Russell Mid Cap Index measures the mid-cap segment performance of the U.S. equity market and is comprised of approximately 800 of the smallest securities based on current index membership and their market capitalization.
- The Russell 2000 Index is a market-capitalization weighted index that measures the performance of 2000 small-cap and mid-cap securities. The index was formulated to give investors an unbiased collection of the smallest tradable equities still meeting exchange listing requirements.
- The MSCI All Country World Index provides a measure of performance for the equity market throughout the world and is a free float-adjusted market capitalization weighted index.
- The MSCI EAFE Index is a market-capitalization weighted index and tracks the performance of small to large-cap equities in developed markets of Europe, Australasia, and the Far East.
- The MSCI Emerging Markets Index is a float-adjusted market-capitalization index that measures equity market performance in global emerging markets and cannot be purchased directly by investors.
- The S&P Global BMI sector indices are divided into sectors as defined by the widely used Global Industry Classification Standards (GICS) classifications. Each sector index comprises those companies included in the S&P Global BMI that are classified as members of respective GICS® sector. The S&P Global BMI Indices were introduced to provide a comprehensive benchmarking system for global equity investors. The S&P Global BMI is comprised of the S&P Emerging BMI and the S&P Developed BMI. It covers approximately 10,000 companies in 46 countries. To be considered for inclusion in the index, all listed stocks within the constituent country must have a float market capitalization of at least $100 million. For a country to be admitted, it must be politically stable and have legal property rights and procedures, among other criteria.
- The Barclay’s US Aggregate Index, a broad based unmanaged bond index that is generally considered to be representative of the performance of the investment grade, US dollar-denominated, fixed-rate taxable bond market.
- The Bloomberg Barclay’s US Corporate High Yield Index, which covers the USD-denominated, non-investment grade, fixed-rate, taxable corporate bond market.
Key Indicators
Key Indicators correspond to various macro-economic and rate-related data points that we consider impactful to equity markets.
- The US 10-Year Treasury Yield (%)/bps, is the return on investment for the U.S. government’s 10-year debt obligation and serves as a signal for investor confidence.
- SPDR Gold Trust Price ($), is an investment fund that reflects the performance on the price of a gold bullion, less the Trust’s expenses.
- West Texas Intermediate, which is an oil benchmark and the underlying asset in the New York Mercantile Exchange’s oil futures contract.
- CBOE Volatility Index (Level)/% Change, which uses price options on the S&P 500 to estimate the market's expectation of 30-day volatility.
This document is intended for informational purposes only and should not be otherwise disseminated to other third parties. Past performance or results should not be taken as an indication or guarantee of future performance or results, and no representation or warranty, express or implied is made regarding future performance or results. This document does not constitute an offer to sell, or a solicitation of an offer to purchase, any security, future or other financial instrument or product. This material is proprietary and being provided on a confidential basis, and may not be reproduced, transferred or distributed in any form without prior written permission from WST. WST reserves the right at any time and without notice to change, amend, or cease publication of the information. The information contained herein includes information that has been obtained from third party sources and has not been independently verified. It is made available on an "as is" basis without warranty and does not represent the performance of any specific investment strategy.
We consider an index to be a portfolio of securities whose composition and proportions are derived from a rules-based model. See the appropriate disclosures regarding models, indices and the related performance. You cannot invest directly in an index and the performance of an index does not represent the performance of any specific investment. Some of the information enclosed may represent opinions of WST and are subject to change from time to time and do not constitute a recommendation to purchase and sale any security nor to engage in any particular investment strategy.
Besides attributed information, this material is proprietary and may not be reproduced, transferred or distributed in any form without prior written permission from WST. WST reserves the right at any time and without notice to change, amend, or cease publication of the information. This material has been prepared solely for informative purposes. The information contained herein may include information that has been obtained from third party sources and has not been independently verified. It is made available on an “as is” basis without warranty. This document is intended for clients for informational purposes only and should not be otherwise disseminated to other third parties. Past performance or results should not be taken as an indication or guarantee of future performance or results, and no representation or warranty, express or implied is made regarding future performance or results. This document does not constitute an offer to sell, or a solicitation of an offer to purchase, any security, future or other financial instrument or product.