
July 2020: Global Equity Markets Review
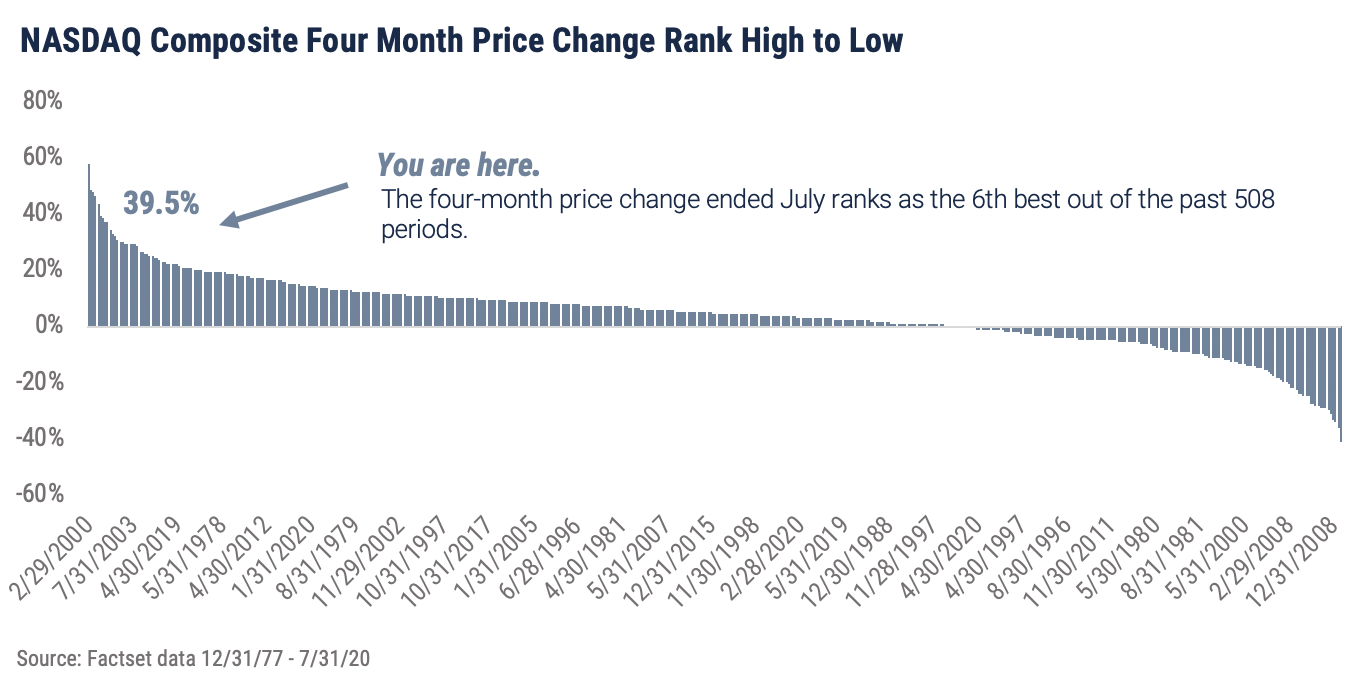
July registered a strong month and was the fourth consecutive month of positive returns coming off the March low. The Technology sector-heavy NASDAQ has been the market leader of late and, as the graph below illustrates, has finished one of the best four-month periods ending July 31st in over 20 years. As expected, growth as a style reasserted its leadership position as well with Technology being the leading sector weight in these benchmarks and easily beat value benchmarks in July. Investor preference was also focused on the larger companies as small cap indices, typically a leader in strong markets, could not keep pace with the large cap benchmarks.
In international equity indices, emerging markets were strong performers helped in large part by dollar weakness. July was the weakest month in almost a decade for the dollar and one of the largest single month declines in almost 35 years. Negative trends in the U.S. around COVID–19 versus the rest of the world and the large amount of dollar denominated debt carried by emerging market economies made these markets beneficiaries of a sharp drop in the U.S. currency. Emerging market returns and the U.S. dollar have an inverse relationship over long periods of time. We do not expect the U.S. dollar to be in a sustained downtrend and believe the outperformance of emerging markets remains at risk to the global pandemic.
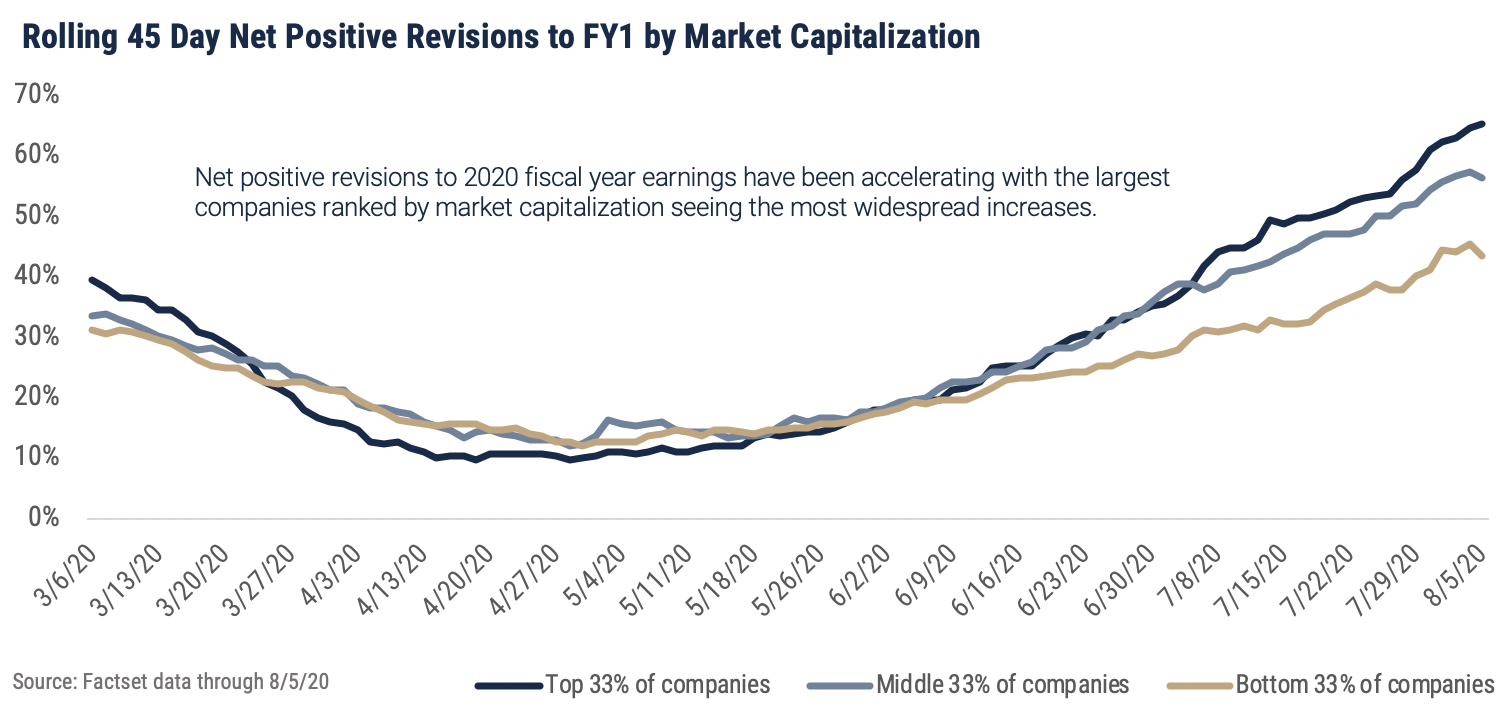
Earnings season is well past the mid-point and the early conclusion is the 2nd quarter has been better than feared. Despite a record lack of guidance by companies for profits in 2020, normally optimistic analysts are raising earnings estimates for the balance of this year. The accompanying graph illustrates where profit forecasts are being boosted - heavily biased by the market capitalization of the company. This in part explains why large cap leadership has been consistent from the market bottom in March. As mentioned in last month’s review, there remains a healthy optimism by analysts of a big increase in earnings for 2021. The current expected increase of 27% between 2020 and 2021 earnings is more than double the median forecast of future growth and ranks in the top 3% of all expected growth rates between fiscal years dating back to 2000. Better economic data sooner than later is critical to keeping 2021 estimates from downward revisions in coming months.
We continue to believe equity markets have priced in a sharp rebound in economic activity which is not substantiated by recent real time data on the reopening of our economy. Stock valuation is elevated as the markets are recovering in price while profit forecasts remain well below levels six months ago. Speculative pockets of market behavior are observable but not pervasive across all sectors and styles. Heightened levels of price volatility suggest reactive behavior to market moves are at risk of being ill-timed. We suggest now is the time to stay committed to long term targets in equity exposure.
Important Disclosures
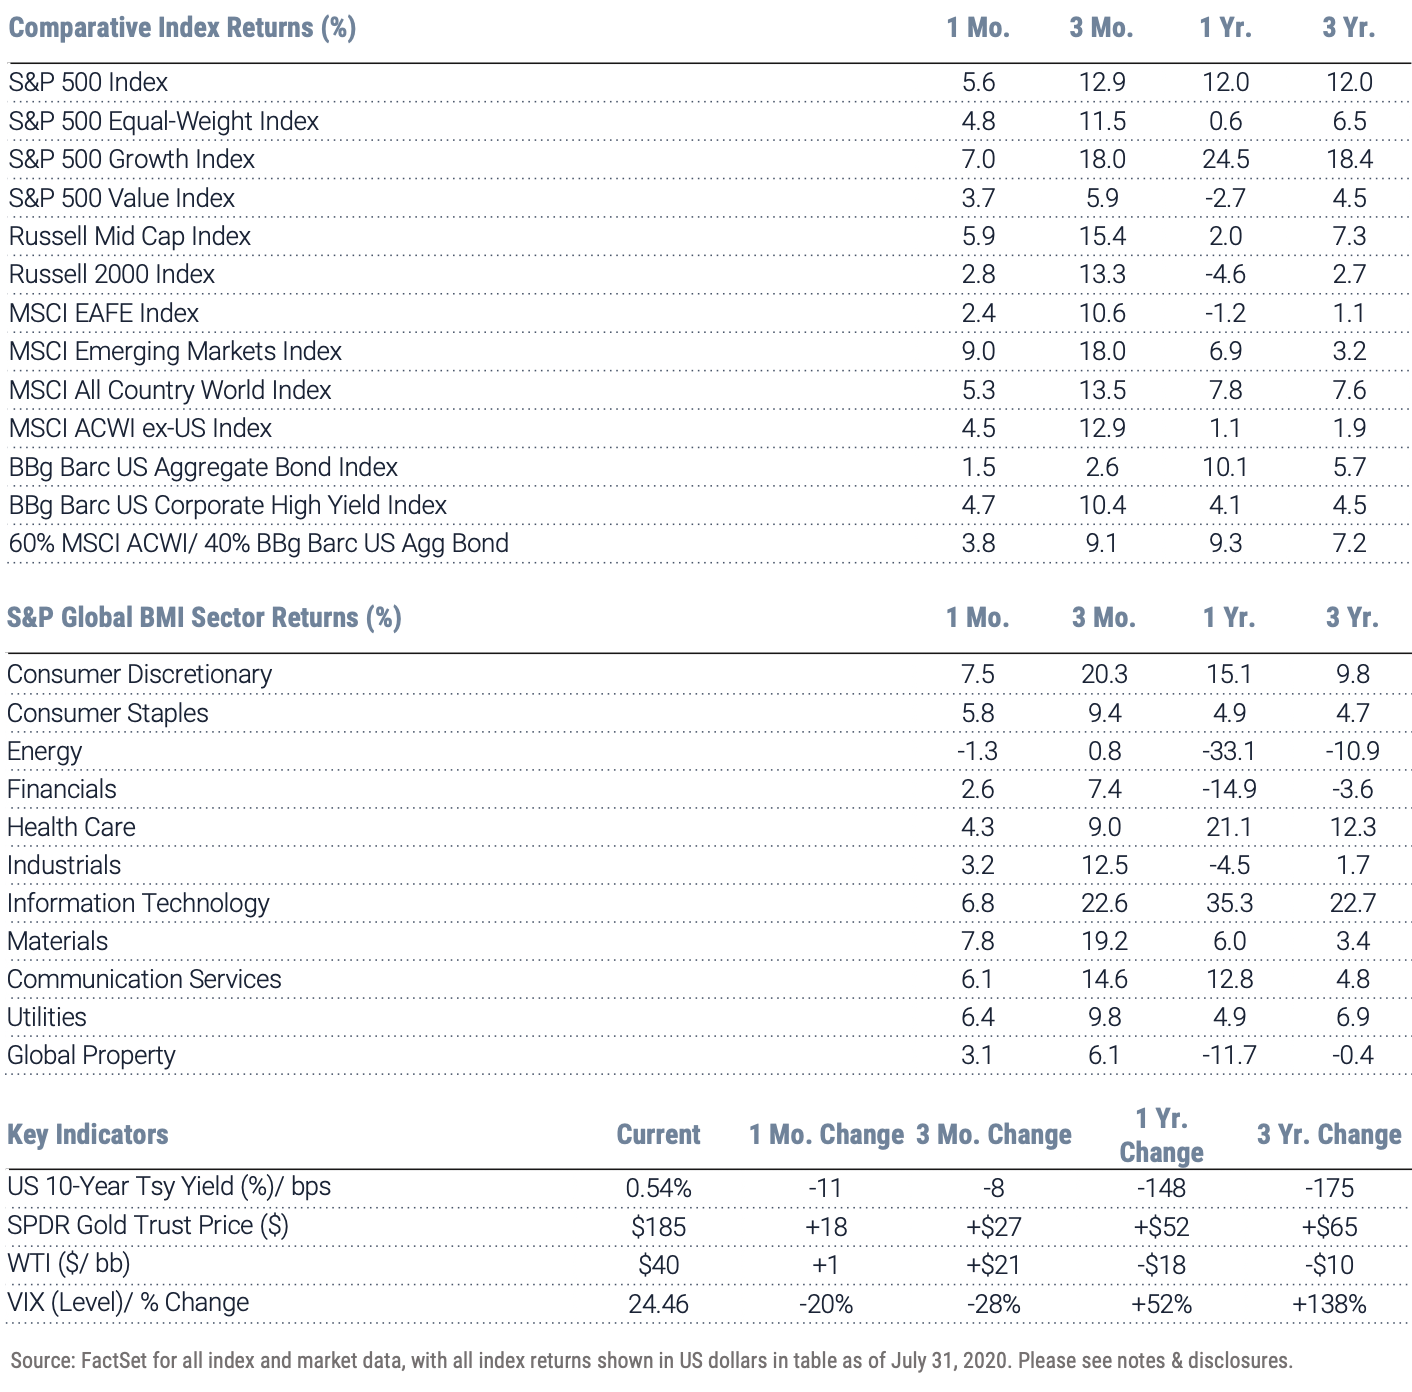
Index Returns – all shown in US dollars
All returns shown trailing 7/31/2020 for the period indicated. “YTD” refers to the total return as of prior-year end, while the other returns are annualized. 3-month and annualized returns are shown for:
- The S&P 500 index is comprised of large capitalized companies across many sectors and is generally regarded as representative of US stock market and is provided in this presentation in that regard only.
- The S&P 500® Equal Weight Index (EWI) is the equal-weight version of the widely-used S&P 500. The index includes the same constituents as the capitalization weighted S&P 500, but each company in the S&P 500 EWI is allocated a fixed weight - or 0.2% of the index total at each quarterly rebalance. The S&P 500 equal-weight index (S&P 500 EWI) series imposes equal weights on the index constituents included in the S&P 500 that are classified in the respective GICS® sector.
- The S&P 500 Growth Index is comprised of equities from the S&P 500 that exhibit strong growth characteristics and is weighted by market-capitalization.
- The S&P 500 Value Index is a market-capitalization weighted index comprising of equities from the S&P 500 that exhibit strong value characteristics such as book value to price ratio, cash flow to price ratio, sales to price ratio, and dividend yield.
- The Russell 3000 Index tracks the performance of 3000 U.S. corporations, determined by market-capitalization, and represents 98% of the investable equity market in the United States.
- The Russell Mid Cap Index measures the mid-cap segment performance of the U.S. equity market and is comprised of approximately 800 of the smallest securities based on current index membership and their market capitalization.
- The Russell 2000 Index is a market-capitalization weighted index that measures the performance of 2000 small-cap and mid-cap securities. The index was formulated to give investors an unbiased collection of the smallest tradable equities still meeting exchange listing requirements.
- The MSCI All Country World Index provides a measure of performance for the equity market throughout the world and is a free float-adjusted market capitalization weighted index.
- The MSCI EAFE Index is a market-capitalization weighted index and tracks the performance of small to large-cap equities in developed markets of Europe, Australasia, and the Far East.
- The MSCI Emerging Markets Index is a float-adjusted market-capitalization index that measures equity market performance in global emerging markets and cannot be purchased directly by investors.
- The S&P Global BMI sector indices are into sectors as defined by the widely used Global Industry Classification Standards (GICS) classifications. Each sector index comprises those companies included in the S&P Global BMI that are classified as members of respective GICS® sector. The S&P Global BMI Indices were introduced to provide a comprehensive benchmarking system for global equity investors. The S&P Global BMI is comprised of the S&P Emerging BMI and the S&P Developed BMI. It covers approximately 10,000 companies in 46 countries. To be considered for inclusion in the index, all listed stocks within the constituent country must have a float market capitalization of at least $100 million. For a country to be admitted, it must be politically stable and have legal property rights and procedures, among other criteria.
- The Barclay’s US Aggregate Index, a broad based unmanaged bond index that is generally considered to be representative of the performance of the investment grade, US dollar-denominated, fixed-rate taxable bond market.
- The Bloomberg Barclay’s US Corporate High Yield Index, which covers the USD-denominated, non-investment grade, fixed-rate, taxable corporate bond market.
Key Indicators
Key Indicators correspond to various macro-economic and rate-related data points that we consider impactful to equity markets.
- The US 10-Year Treasury Yield (%)/bps, is the return on investment for the U.S. government’s 10-year debt obligation and serves as a signal for investor confidence.
- SPDR Gold Trust Price ($), is an investment fund that reflects the performance on the price of a gold bullion, less the Trust’s expenses.
- West Texas Intermediate, which is an oil benchmark and the underlying asset in the New York Mercantile Exchange’s oil futures contract.
- CBOE Volatility Index (Level)/% Change, which uses price options on the S&P 500 to estimate the market's expectation of 30-day volatility.
Wilbanks, Smith & Thomas Asset Management (WST) is an investment adviser registered under the Investment Advisers Act of 1940. Registration as an investment adviser does not imply any level of skill or training. The information presented in the material is general in nature and is not designed to address your investment objectives, financial situation or particular needs. Prior to making any investment decision, you should assess, or seek advice from a professional regarding whether any particular transaction is relevant or appropriate to your individual circumstances. This material is not intended to replace the advice of a qualified tax advisor, attorney, or accountant. Consultation with the appropriate professional should be done before any financial commitments regarding the issues related to the situation are made.
This document is intended for informational purposes only and should not be otherwise disseminated to other third parties. Past performance or results should not be taken as an indication or guarantee of future performance or results, and no representation or warranty, express or implied is made regarding future performance or results. This document does not constitute an offer to sell, or a solicitation of an offer to purchase, any security, future or other financial instrument or product. This material is proprietary and being provided on a confidential basis, and may not be reproduced, transferred or distributed in any form without prior written permission from WST. WST reserves the right at any time and without notice to change, amend, or cease publication of the information. This material has been prepared solely for informative purposes. The information contained herein includes information that has been obtained from third party sources and has not been independently verified. It is made available on an "as is" basis without warranty and does not represent the performance of any specific investment strategy.
We consider an index to be a portfolio of securities whose composition and proportions are derived from a rules-based model. See the appropriate disclosures regarding models, indices and the related performance. You cannot invest directly in an index and the performance of an index does not represent the performance of any specific investment. Some of the information enclosed may represent opinions of WST and are subject to change from time to time and do not constitute a recommendation to purchase and sale any security nor to engage in any particular investment strategy.
Besides attributed information, this material is proprietary and may not be reproduced, transferred or distributed in any form without prior written permission from WST. WST reserves the right at any time and without notice to change, amend, or cease publication of the information. This material has been prepared solely for informative purposes. The information contained herein may include information that has been obtained from third party sources and has not been independently verified. It is made available on an “as is” basis without warranty. This document is intended for clients for informational purposes only and should not be otherwise disseminated to other third parties. Past performance or results should not be taken as an indication or guarantee of future performance or results, and no representation or warranty, express or implied is made regarding future performance or results. This document does not constitute an offer to sell, or a solicitation of an offer to purchase, any security, future or other financial instrument or product.