
January 2020: Global Equity Market Review
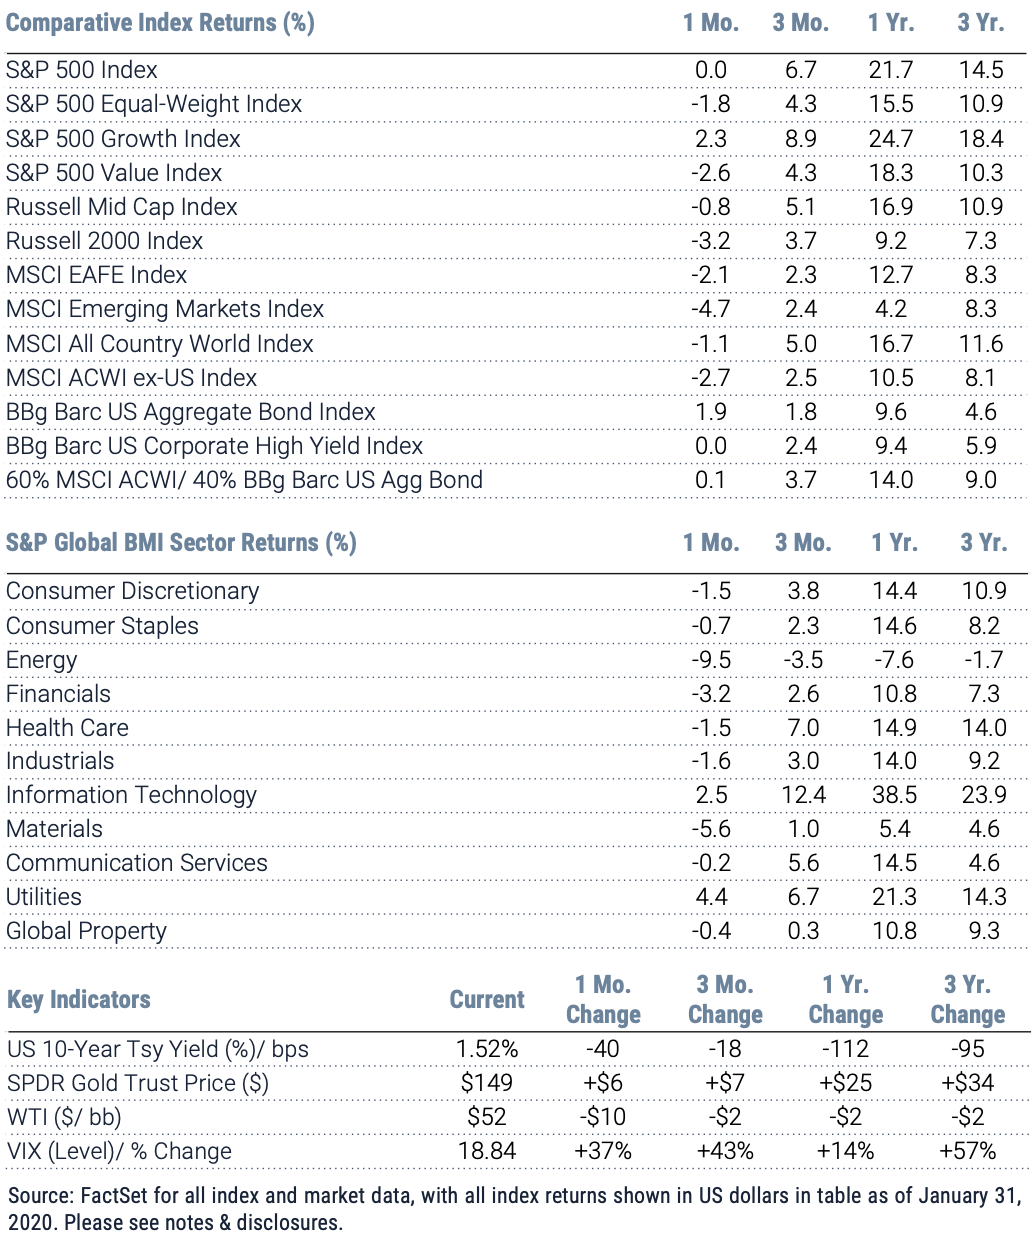
After a lights-out finish to 2019 and a strong start to January, equity bulls were halted in their tracks mid-month as news broke and rapidly escalated regarding the deadly coronavirus, which appears to have originated in Wuhan, China. Global equities as measured by the MSCI All Country World Index shed 1.1%, with the US (exactly flat for the S&P 500) faring best thanks to safe-haven status and related US dollar-strengthening. Developed international equities fell 2.7% and emerging markets, down 4.7%, were unsurprisingly worst for the wear.
In isolation any of January’s major headlines – open threats of war and acts of aggression between nuclear powers, a US presidential impeachment proceeding and an emerging pandemic – would seem sufficient to rattle risk-asset markets and rally bond markets. Investors were resilient initially, however, shaking off US-Iran tensions just as quickly as the situation de-escalated and overall appearing indifferent to political drama in the US. Major items of political progress combined with the apparent recovery in global fundamentals had equity bulls well-encouraged to continue the exuberant push tipped off in December ’19. This optimism appeared to be bearing out in early corporate results – at month-end with nearly 60% of companies having reported, the S&P 500 was in aggregate topping earnings expectations by nearly 5% and charting a robust growth rate. The S&P 500 indeed marked a new high on January 17th, applauding early results and the signing of the Phase One deal on the path to a US-China trade resolution.
Markets capitulated, however, as the coronavirus began to take shape as a potential pandemic capable of grounding the global economic recovery just as it swiftly as it ground certain international travel and trade.
Global sector performance clearly articulated market calculus relative to this particular story; Utilities, a staple in flight-to-safety playbooks, were up 4.4%, while Consumer Staples and Communication Services were best off among losing sectors. Technology (+2.5%) was buffered by a strong start to the month but also benefitted during the sell-off from its US-heavy constituency. Financials weakened on the possibility of further rate cuts in a recessionary scenario, while weakness in Materials and Industrials reflected concern about the virus impact on global supply chains, costs and demand overall. Energy captured these concerns but was further at the mercy of a major intra-month oil price rally-and-reversal off the US-Iran “World War 3” fiasco that was, ultimately, soft-landed.
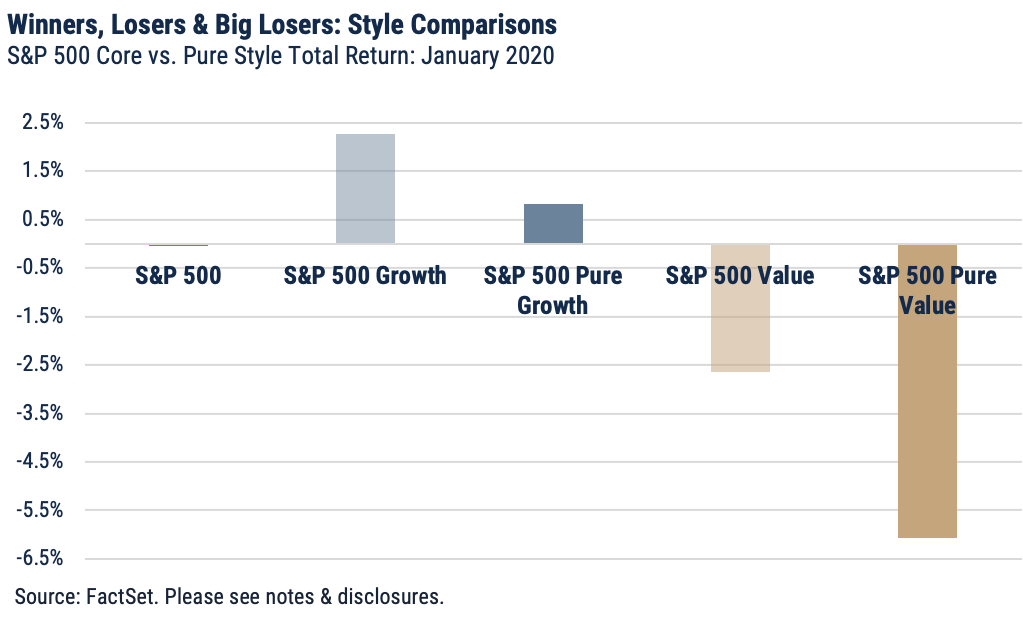
The S&P 500 yielded a wash overall but there were clear winners and losers, and January’s events pumped the brakes on what, through 4Q ’19, appeared to be pro-cyclical rotations emerging across factors in the US. Meaningful underperformance by the S&P 500 Equal-Weight Index (-1.8%) versus the flat S&P 500 speaks to the comparative disadvantage of value characteristics and smaller size during January. The S&P 500 Value (-2.6%) lagged the S&P 500 Growth (+2.3%) by a whopping margin, reflecting the safe-haven stature of the growth-heavy tech sector. The chart below at right, which shows the core style indices versus their pure style counterparts (i.e., indices with strict value or growth criteria) evidences this flight-to-core impulse, as concentrated factors on both sides underperformed more diluted style expressions – all said, this dynamic marked a major reversal from the prior quarter’s emerging, much-anticipated style rotation.
International equities shed 2.7% (USD) during January, with currency impacts accounting for roughly 110 basis points to the negative, in dollar terms. Developed ex-US, as measured by the MSCI EAFE, fell 2.1% USD (-1.2% local), with slight Yen appreciation versus the dollar providing a modest hedge to otherwise more pronounced currency headwinds. Japan, Germany, France and United Kingdom (together roughly 50% of the developed ex-US universe) each shed low single digits in local terms. Switzerland, which like Japan saw its currency appreciate, was a modestly positive performer, adding 40 basis points in local and 80 basis points in USD terms.
After a standout December powered in large part by rallying currency, emerging markets equities were predictably marred both by coronavirus panic and by related currency reversals. Down 4.7% in USD terms (-3.3% local), the segment was the month’s biggest loser. China – roughly a third of the index - bore the worst of the virus-related selling, shedding nearly 5%, while Korea (over 10% of the index) fell a full 5.3% in USD. Brazil and South Africa – together around 15% of the emerging universe – both declined around 2% in local terms but felt another 600 basis points in pain from rapidly retracing currencies. India shed less than a percent in both local and dollar terms, while Mexico was up roughly 1.7%
Important Disclosures
Index Returns – all shown in US dollars
All returns shown trailing 1/31/2020 for the period indicated. “YTD” refers to the total return as of prior-year end, while the other returns are annualized. 3-month and annualized returns are shown for:
- The S&P 500 index is comprised of large capitalized companies across many sectors and is generally regarded as representative of US stock market and is provided in this presentation in that regard only.
- The S&P 500® Equal Weight Index (EWI) is the equal-weight version of the widely-used S&P 500. The index includes the same constituents as the capitalization weighted S&P 500, but each company in the S&P 500 EWI is allocated a fixed weight - or 0.2% of the index total at each quarterly rebalance. The S&P 500 equal-weight index (S&P 500 EWI) series imposes equal weights on the index constituents included in the S&P 500 that are classified in the respective GICS® sector.
- The S&P 500 Growth Index is comprised of equities from the S&P 500 that exhibit strong growth characteristics and is weighted by market-capitalization.
- The S&P 500 Value Index is a market-capitalization weighted index comprising of equities from the S&P 500 that exhibit strong value characteristics such as book value to price ratio, cash flow to price ratio, sales to price ratio, and dividend yield.
- The Russell 3000 Index tracks the performance of 3000 U.S. corporations, determined by market-capitalization, and represents 98% of the investable equity market in the United States.
- The Russell Mid Cap Index measures the mid-cap segment performance of the U.S. equity market and is comprised of approximately 800 of the smallest securities based on current index membership and their market capitalization.
- The Russell 2000 Index is a market-capitalization weighted index that measures the performance of 2000 small-cap and mid-cap securities. The index was formulated to give investors an unbiased collection of the smallest tradable equities still meeting exchange listing requirements.
- The MSCI All Country World Index provides a measure of performance for the equity market throughout the world and is a free float-adjusted market capitalization weighted index.
- The MSCI EAFE Index is a market-capitalization weighted index and tracks the performance of small to large-cap equities in developed markets of Europe, Australasia, and the Far East.
- The MSCI Emerging Markets Index is a float-adjusted market-capitalization index that measures equity market performance in global emerging markets and cannot be purchased directly by investors.
- The S&P Global BMI sector indices are into sectors as defined by the widely used Global Industry Classification Standards (GICS) classifications. Each sector index comprises those companies included in the S&P Global BMI that are classified as members of respective GICS® sector. The S&P Global BMI Indices were introduced to provide a comprehensive benchmarking system for global equity investors. The S&P Global BMI is comprised of the S&P Emerging BMI and the S&P Developed BMI. It covers approximately 10,000 companies in 46 countries. To be considered for inclusion in the index, all listed stocks within the constituent country must have a float market capitalization of at least $100 million. For a country to be admitted, it must be politically stable and have legal property rights and procedures, among other criteria.
- The Barclay’s US Aggregate Index, a broad based unmanaged bond index that is generally considered to be representative of the performance of the investment grade, US dollar-denominated, fixed-rate taxable bond market.
- The Bloomberg Barclay’s US Corporate High Yield Index, which covers the USD-denominated, non-investment grade, fixed-rate, taxable corporate bond market.
Key Indicators
Key Indicators correspond to various macro-economic and rate-related data points that we consider impactful to equity markets.
- The US 10-Year Treasury Yield (%)/bps, is the return on investment for the U.S. government’s 10-year debt obligation and serves as a signal for investor confidence.
- SPDR Gold Trust Price ($), is an investment fund that reflects the performance on the price of a gold bullion, less the Trust’s expenses.
- West Texas Intermediate, which is an oil benchmark and the underlying asset in the New York Mercantile Exchange’s oil futures contract.
- CBOE Volatility Index (Level)/% Change, which uses price options on the S&P 500 to estimate the market's expectation of 30-day volatility.
This document is intended for informational purposes only and should not be otherwise disseminated to other third parties. Past performance or results should not be taken as an indication or guarantee of future performance or results, and no representation or warranty, express or implied is made regarding future performance or results. This document does not constitute an offer to sell, or a solicitation of an offer to purchase, any security, future or other financial instrument or product. This material is proprietary and being provided on a confidential basis, and may not be reproduced, transferred or distributed in any form without prior written permission from WST. WST reserves the right at any time and without notice to change, amend, or cease publication of the information. This material has been prepared solely for informative purposes. The information contained herein includes information that has been obtained from third party sources and has not been independently verified. It is made available on an "as is" basis without warranty and does not represent the performance of any specific investment strategy.
We consider an index to be a portfolio of securities whose composition and proportions are derived from a rules-based model. See the appropriate disclosures regarding models, indices and the related performance. You cannot invest directly in an index and the performance of an index does not represent the performance of any specific investment. Some of the information enclosed may represent opinions of WST and are subject to change from time to time and do not constitute a recommendation to purchase and sale any security nor to engage in any particular investment strategy.
Past performance or results should not be taken as an indication or guarantee of future performance or results, and no representation or warranty, express or implied is made regarding future performance or results.
Besides attributed information, this material is proprietary and may not be reproduced, transferred or distributed in any form without prior written permission from WST. WST reserves the right at any time and without notice to change, amend, or cease publication of the information. This material has been prepared solely for informative purposes. The information contained herein may include information that has been obtained from third party sources and has not been independently verified. It is made available on an “as is” basis without warranty. This document is intended for clients for informational purposes only and should not be otherwise disseminated to other third parties. Past performance or results should not be taken as an indication or guarantee of future performance or results, and no representation or warranty, express or implied is made regarding future performance or results. This document does not constitute an offer to sell, or a solicitation of an offer to purchase, any security, future or other financial instrument or product.