
January 2019 Global Equity Markets Review
The clouds parted for global markets in January, delivering high-single- or low-double-digit returns across essentially all equity geographies and styles; global stocks as measured by the MSCI All Country World Index added 7.9%. Investors brushed off concerns about softening economic data and the effects of the government shutdown, and while there was no definitive movement on any single theme that crumbled markets in 4Q, risk assets appear buoyed by constructive shifts in US-China talks and, most importantly, the Fed’s pledge to be “patient.”
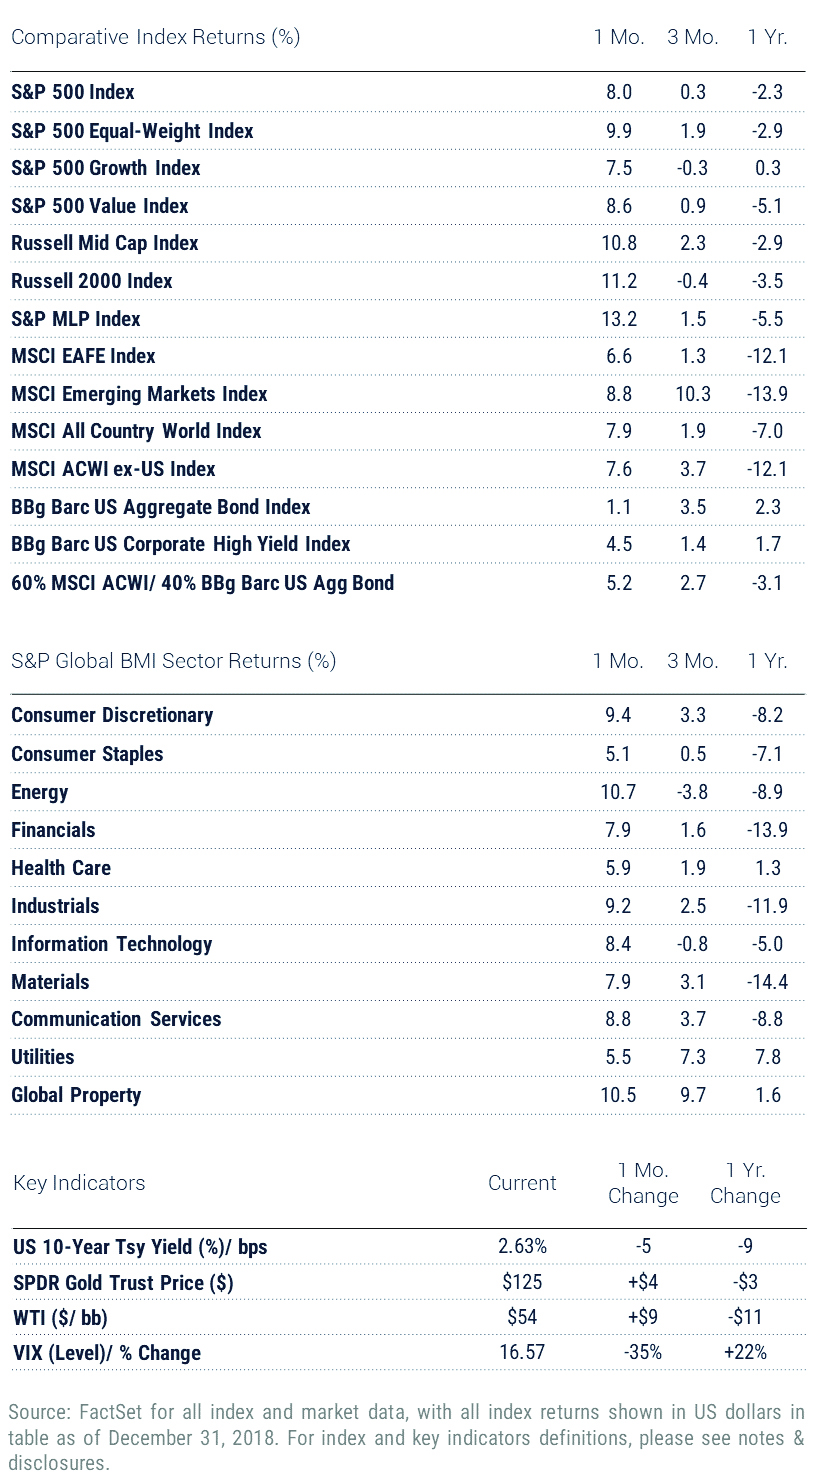
The S&P 500 posted a gain of 8.0% and the S&P 500 Equal-Weight (+9.9%) outperformed, in keeping with an exuberant change of sentiment towards the back half of the capitalization spectrum. US small caps, as measured by the Russell 2000 Index, posted a market-leading return of 11.2%. The S&P 500 Value outperformed the S&P 500 Growth by 110 basis points, while growth outperformed in broader indices such as the Russell 1000, capturing the rebound in smaller names. As global trade negotiations softened in tone, Industrials (+11.4%) led the US from a sector perspective and were followed by an Energy sector (+11.1%) that regrouped from a catastrophic 4Q on the back of a rally in oil price.
Global sectors were uniformly positive, led by returns again from Energy (+10.7%) and Global Property (+10.5%), which managed to avoid most of the downside from softening global growth headlines during 4Q. In January, even as the IMF released its downward revision for global growth and China posted anemic export data, the sector pushed ahead on accommodative signals from central banks. Given the comparative growth backdrop, investors were more bullish on US Industrials and Materials than the global sectors overall, while global Technology outperformed the US sector thanks to greater diversification.
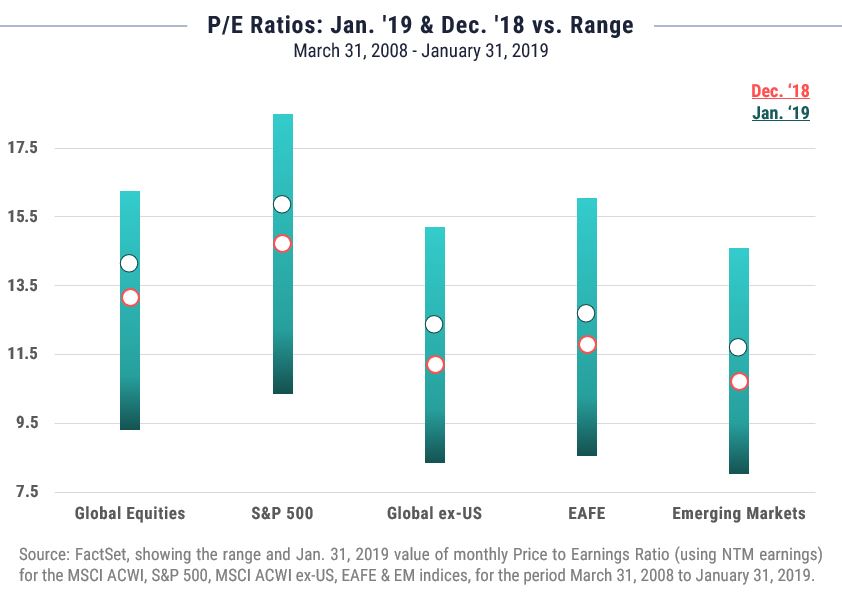
The MSCI EAFE (+6.6%) posted a robust return but remains the laggard in recent periods, dogged by Europe-driven sentiment so poor that investors appear to be resisting the would-be valuation bait. On a trailing 1-year basis, developed ex-US looks set to be overtaken by emerging markets (+8.8%), which outperformed the US for the third month in a row and slipped into the double-digits for the trailing 3-month period. Emerging economies seem to have found inflection points on top of better-performing local currencies and moderated guidance by the US Fed.
Dis-aggregated January performance for the index confirms that the drivers in that segment are diverse - that is, performance was not solely attributable to the 11.1% rebound in China (which comprises a third of the index) and Korea (+10.3%, and around 15% of the index). Brazil and South Africa – together a roughly 15% weight – posted returns of 17.8% and 12.3% respectively, with the former driven by bullish reception for its new pro-market president. South Africa - laid low in 2018 by poor economic sentiment and political upheaval – has seen its outlook brighten. Finally, India – at a 10% weight in the index – stumbled, shedding around 190 basis points on news that unemployment had reached at 45-year high and accusations that the current government had suppressed that data; the country nonetheless looks set to surpass China in GDP growth.
For more market reviews, visit the WST blog.
Important Disclosures
Index Returns – all shown in US dollars
All returns shown trailing 1/31/2019 for the period indicated. “YTD” refers to the total return as of prior-year end, while the other returns are annualized. 3-month and annualized returns are shown for:
- The S&P 500 index is comprised of large capitalized companies across many sectors and is generally regarded as representative of US stock market and is provided in this presentation in that regard only.
- The S&P 500® Equal Weight Index (EWI) is the equal-weight version of the widely-used S&P 500. The index includes the same constituents as the capitalization weighted S&P 500, but each company in the S&P 500 EWI is allocated a fixed weight - or 0.2% of the index total at each quarterly rebalance. The S&P 500 equal-weight index (S&P 500 EWI) series imposes equal weights on the index constituents included in the S&P 500 that are classified in the respective GICS® sector.
- The S&P 500 Growth Index is comprised of equities from the S&P 500 that exhibit strong growth characteristics and is weighted by market-capitalization.
- The S&P 500 Value Index is a market-capitalization weighted index comprising of equities from the S&P 500 that exhibit strong value characteristics such as book value to price ratio, cash flow to price ratio, sales to price ratio, and dividend yield.
- The Russell 3000 Index tracks the performance of 3000 U.S. corporations, determined by market-capitalization, and represents 98% of the investable equity market in the United States.
- The Russell Mid Cap Index measures the mid-cap segment performance of the U.S. equity market and is comprised of approximately 800 of the smallest securities based on current index membership and their market capitalization.
- The Russell Micro Cap Index is a market-capitalization weighted index that measures the performance of 2000 small-cap and mid-cap securities. The index was formulated to give investors an unbiased collection of the smallest tradable equities still meeting exchange listing requirements.
- The MSCI All Country World Index provides a measure of performance for the equity market throughout the world and is a free float-adjusted market capitalization weighted index.
- The MSCI EAFE Index is a market-capitalization weighted index and tracks the performance of small to large-cap equities in developed markets of Europe, Australasia, and the Far East.
- The MSCI Emerging Markets Index is a float-adjusted market-capitalization index that measures equity market performance in global emerging markets and cannot be purchased directly by investors.
- The S&P Global BMI sector indices are into sectors as defined by the widely used Global Industry Classification Standards (GICS) classifications. Each sector index comprises those companies included in the S&P Global BMI that are classified as members of respective GICS® sector. The S&P Global BMI Indices were introduced to provide a comprehensive benchmarking system for global equity investors. The S&P Global BMI is comprised of the S&P Emerging BMI and the S&P Developed BMI. It covers approximately 10,000 companies in 46 countries. To be considered for inclusion in the index, all listed stocks within the constituent country must have a float market capitalization of at least $100 million. For a country to be admitted, it must be politically stable and have legal property rights and procedures, among other criteria.
- The Barclay’s US Aggregate Index, a broad based unmanaged bond index that is generally considered to be representative of the performance of the investment grade, US dollar-denominated, fixed-rate taxable bond market.
- The Bloomberg Barclay’s US Corporate High Yield Index, which covers the USD-denominated, non-investment grade, fixed-rate, taxable corporate bond market.
Key Indicators
Key Indicators correspond to various macro-economic and rate-related data points that we consider impactful to equity markets.
- The US 10-Year Treasury Yield (%)/bps, is the return on investment for the U.S. government’s 10-year debt obligation and serves as a signal for investor confidence.
- SPDR Gold Trust Price ($), is an investment fund that reflects the performance on the price of a gold bullion, less the Trust’s expenses.
- West Texas Intermediate, which is an oil benchmark and the underlying asset in the New York Mercantile Exchange’s oil futures contract.
- CBOE Volatility Index (Level)/% Change, which uses price options on the S&P 500 to estimate the market's expectation of 30-day volatility.
General Disclosure
This document is intended for informational purposes only and should not be otherwise disseminated to other third parties. Past performance or results should not be taken as an indication or guarantee of future performance or results, and no representation or warranty, express or implied is made regarding future performance or results. This document does not constitute an offer to sell, or a solicitation of an offer to purchase, any security, future or other financial instrument or product. This material is proprietary and being provided on a confidential basis, and may not be reproduced, transferred or distributed in any form without prior written permission from WST. WST reserves the right at any time and without notice to change, amend, or cease publication of the information. This material has been prepared solely for informative purposes. The information contained herein includes information that has been obtained from third party sources and has not been independently verified. It is made available on an "as is" basis without warranty and does not represent the performance of any specific investment strategy.
This commentary also includes performance figures for the SPDR Gold Trust (GLD), which is held in the SSRM model but in this case is used as a proxy for the performance of the asset class, given the security’s prominence as a means of accessing exposure to the asset class. We believe use of this proxy is appropriate in the context of providing our clients and Advisors with relevant information about markets. We consider an index to be a portfolio of securities whose composition and proportions are derived from a rules-based model. See the appropriate disclosures regarding models, indices and the related performance. You cannot invest directly in an index and the performance of an index does not represent the performance of any specific investment. Some of the information enclosed may represent opinions of WST and are subject to change from time to time and do not constitute a recommendation to purchase and sale any security nor to engage in any particular investment strategy.
Past performance or results should not be taken as an indication or guarantee of future performance or results, and no representation or warranty, express or implied is made regarding future performance or results. This document does not constitute an offer to sell, or a solicitation of an offer to purchase, any security, future or other financial instrument or product. This material is proprietary and being provided on a confidential basis, and may not be reproduced, transferred or distributed in any form without prior written permission from WST. WST reserves the right at any time and without notice to change, amend, or cease publication of the information. This material has been prepared solely for informative purposes. The information contained herein includes information that has been obtained from third party sources and has not been independently verified. It is made available on an "as is" basis without warranty and does not represent the performance of any specific investment .Some of the information enclosed may represent opinions of WST and are subject to change from time to time and do not constitute a recommendation to purchase and sale any security nor to engage in any particular investment strategy. The information contained herein has been obtained from sources believed to be reliable but cannot be guaranteed for accuracy. Past performance is not necessarily indicative of future results. Securities and services are not FDIC or any other government agency insured – Are not bank guaranteed – May lose Value.
Besides attributed information, this material is proprietary and may not be reproduced, transferred or distributed in any form without prior written permission from WST. WST reserves the right at any time and without notice to change, amend, or cease publication of the information. This material has been prepared solely for informative purposes. The information contained herein may include information that has been obtained from third party sources and has not been independently verified. It is made available on an “as is” basis without warranty. This document is intended for clients for informational purposes only and should not be otherwise disseminated to other third parties. Past performance or results should not be taken as an indication or guarantee of future performance or results, and no representation or warranty, express or implied is made regarding future performance or results. This document does not constitute an offer to sell, or a solicitation of an offer to purchase, any security, future or other financial instrument or product.