
April 2021 | Global Equity Markets Review
Equity markets continued their upward trajectory in April although leadership differed markedly from year-to-date patterns. The overall U.S. equity return as measured by the Russell 3000 Index returned 5.15% in April which represented the strongest monthly return since last November. Despite evidence continuing to accumulate in favor of a re-acceleration of economic activity, leadership within the market shifted back to large cap growth stocks which were the clear leaders during the early months of the global pandemic. During the month, laggards within the U.S. equity market were smaller cap and value stocks – understandably, given how strong recent performance has been since last fall.
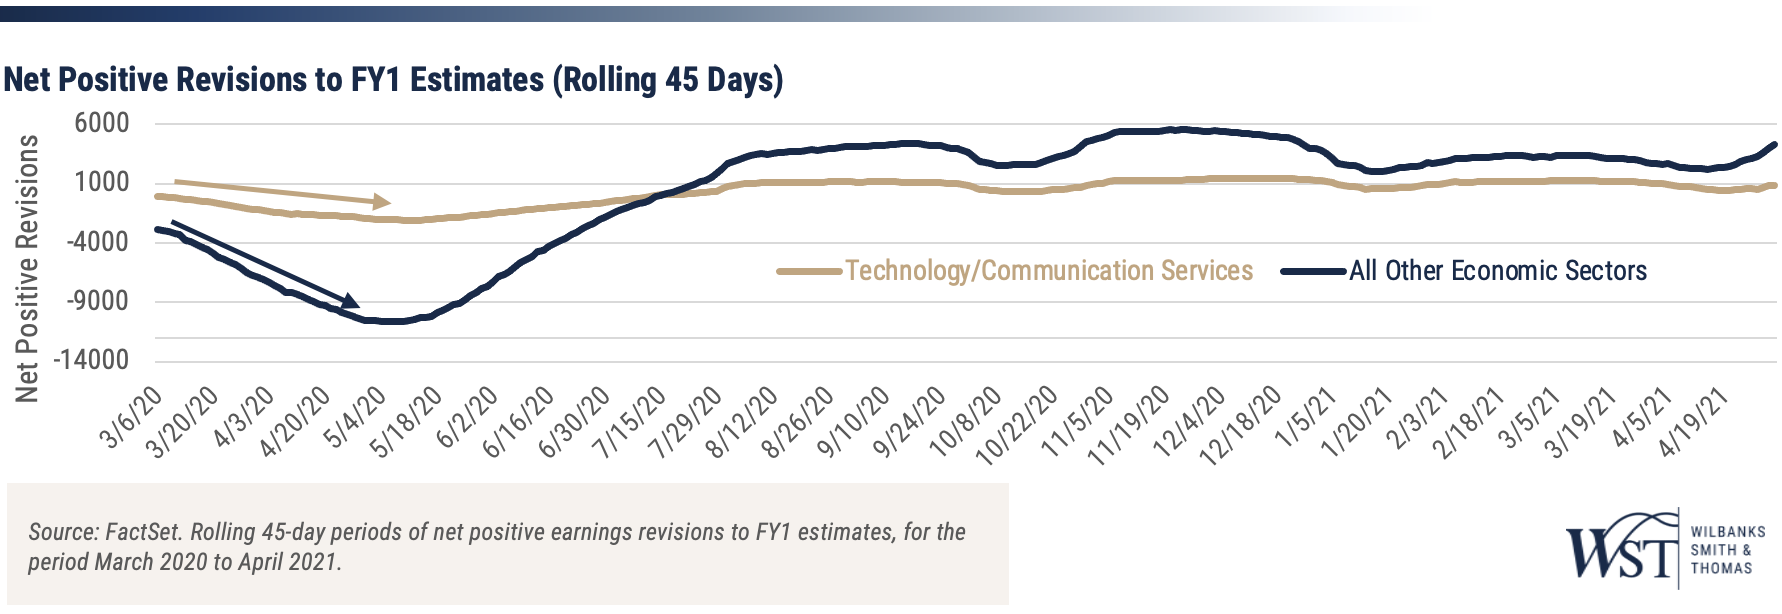
We have written in past monthly reviews how stocks anticipated the rebound in economic activity. This can be seen in estimated earnings revisions which are an important component in investor confidence. Forward estimates for the next twelve-month earnings provided by Wall Street analysts have rebounded sharply higher in recent months.
Companies that reported 1st quarter earnings in April resulting in positive earnings revisions outperformed those with negative revisions – a healthy sign for the markets. Underneath the overall revision trend is a clear shift toward non-technology and communication services sectors which were hit hardest by the forced shutdown of the economy last year. The below graph illustrates the comparison between revision trends and one we expect to continue with an accelerating economy. This would suggest the shift in leadership in April toward pandemic-related beneficiaries in the stock market will be temporary with cyclical value and smaller stocks moving back in favor in the coming months.
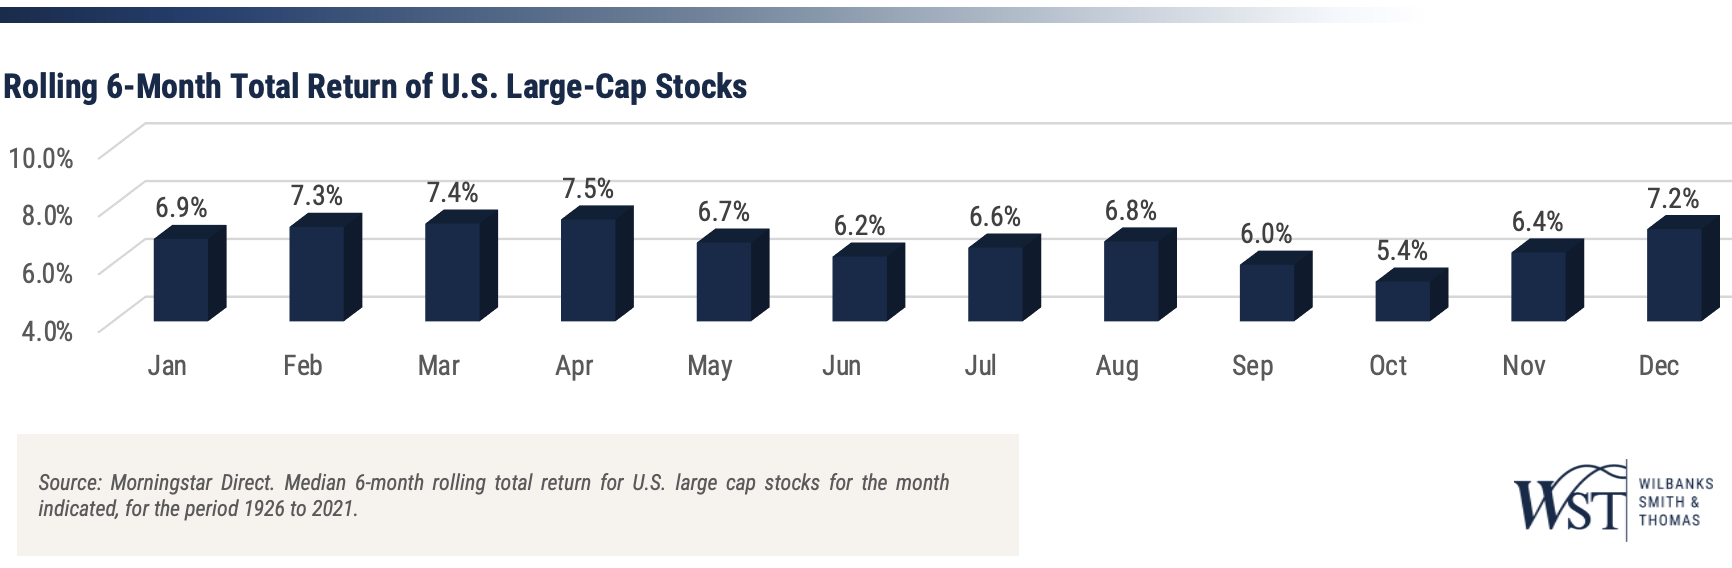
One of the least reliable trading strategies is the seasonal idiom in the stock market which suggests a meaningful difference in return patterns from the May – November period and the December – April period. The mental trap in analyzing any volatile return set like stocks is seeing patterns where they do not exist. Pattern recognition bias is a common cognitive error and one we would caution clients to avoid. The graph below uses over 95 years of U.S. large capitalization stock returns grouped in six-month periods for the months highlighted. While return differences exist from one six-month period to the next, when sorted by the calendar there is no statistical significance to the pattern. Investors who may have followed this strategy in 2020 would have missed one of the strongest May – November six-month returns in over a decade, respectively. With strong economic momentum ahead along with monetary and fiscal stimulus still in high gear, we would encourage investors to limit the use of this rule as a rationale for becoming more cautious.
We believe positive factors for maintaining equity exposure outweigh negative considerations as earnings momentum is strong and is offsetting high valuations for now. As the economy rapidly improves, the Federal Reserve is waiting patiently to tap the brakes and fiscal policy remains in a highly expansive stimulus mode. Jay Powell, Chair of the Federal Reserve Board, called the recent increase in inflation measures "temporary". After an initial surge in long-term interest rates earlier in the year, bond investors are in a wait-and-see posture for the moment, taking pressure off equity market valuations. The willingness of equity investors to brace against an economy that may well run “too hot” in the months ahead will be the key consideration once the current earnings season subsides. Volatility and leadership shifts within and across geographies could continue, in our opinion, and argues against trading tactics to capture these short-term and unpredictable moves. We remain constructive on the equity market but mindful of valuation levels as negative incremental news may cause a downside market response investors have not yet discounted.
Important Notes & Disclosures
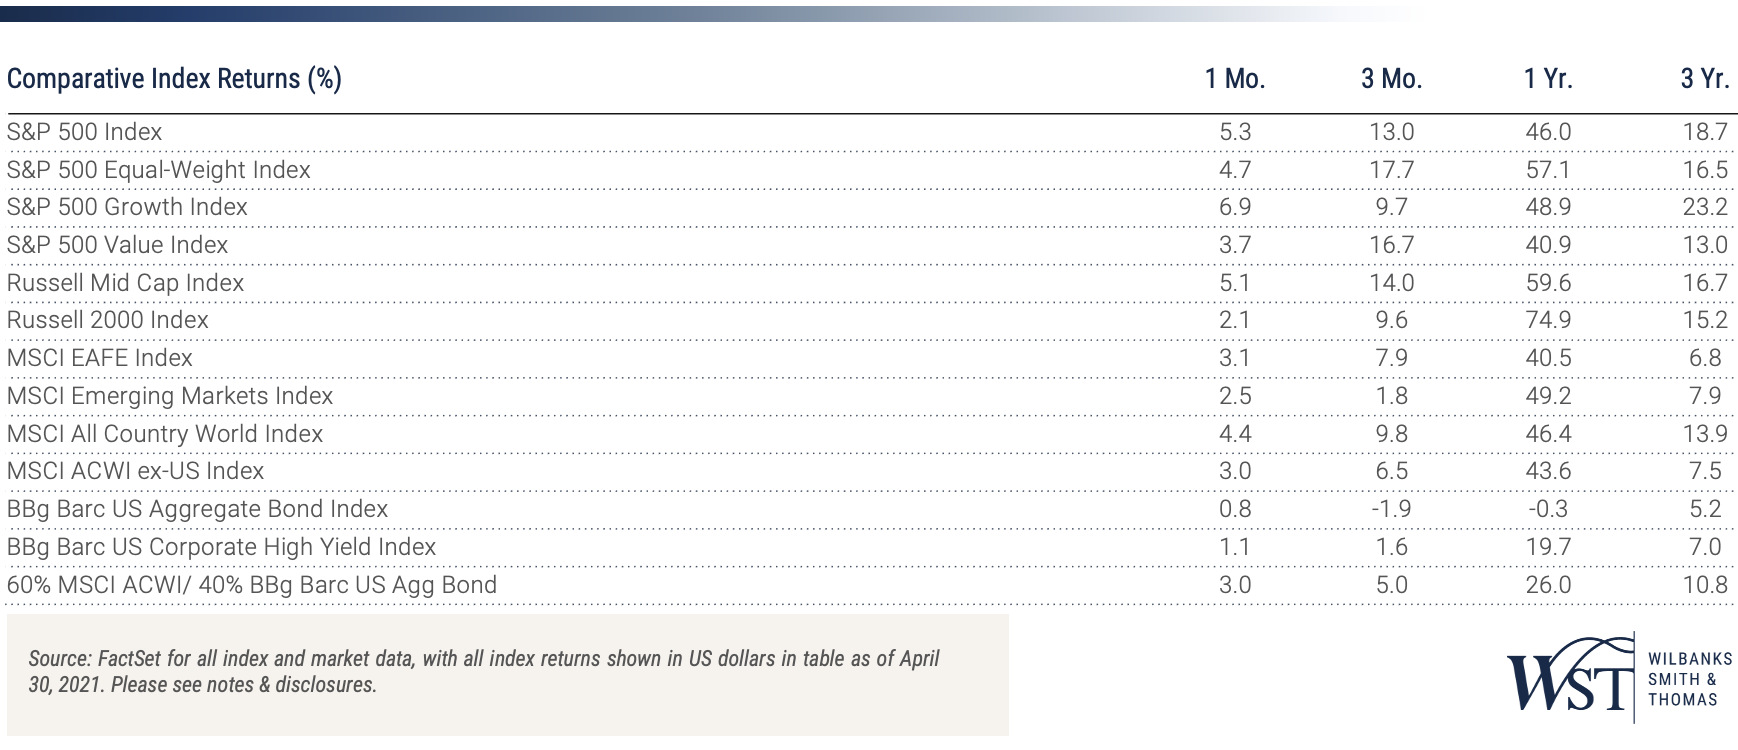
Index Returns – all shown in US dollars
All returns shown trailing 4/30/2021 for the period indicated. “YTD” refers to the total return as of prior-year end, while the other returns are annualized. 3-month and annualized returns are shown for:
- The S&P 500 index is comprised of large capitalized companies across many sectors and is generally regarded as representative of US stock market and is provided in this presentation in that regard only.
- The S&P 500® Equal Weight Index (EWI) is the equal-weight version of the widely-used S&P 500. The index includes the same constituents as the capitalization weighted S&P 500, but each company in the S&P 500 EWI is allocated a fixed weight - or 0.2% of the index total at each quarterly rebalance. The S&P 500 equal-weight index (S&P 500 EWI) series imposes equal weights on the index constituents included in the S&P 500 that are classified in the respective GICS® sector.
- The S&P 500 Growth Index is comprised of equities from the S&P 500 that exhibit strong growth characteristics and is weighted by market-capitalization.
- The S&P 500 Value Index is a market-capitalization weighted index comprising of equities from the S&P 500 that exhibit strong value characteristics such as book value to price ratio, cash flow to price ratio, sales to price ratio, and dividend yield.
- The Russell 3000 Index tracks the performance of 3000 U.S. corporations, determined by market-capitalization, and represents 98% of the investable equity market in the United States.
- The Russell Mid Cap Index measures the mid-cap segment performance of the U.S. equity market and is comprised of approximately 800 of the smallest securities based on current index membership and their market capitalization.
- The Russell 2000 Index is a market-capitalization weighted index that measures the performance of 2000 small-cap and mid-cap securities. The index was formulated to give investors an unbiased collection of the smallest tradable equities still meeting exchange listing requirements.
- The MSCI All Country World Index provides a measure of performance for the equity market throughout the world and is a free float-adjusted market capitalization weighted index.
- The MSCI EAFE Index is a market-capitalization weighted index and tracks the performance of small to large-cap equities in developed markets of Europe, Australasia, and the Far East.
- The MSCI Emerging Markets Index is a float-adjusted market-capitalization index that measures equity market performance in global emerging markets and cannot be purchased directly by investors.
- The S&P Global BMI sector indices are into sectors as defined by the widely used Global Industry Classification Standards (GICS) classifications. Each sector index comprises those companies included in the S&P Global BMI classified as members of the respective GICS® sector. The S&P Global BMI Indices were introduced to provide a comprehensive benchmarking system for global equity investors. The S&P Global BMI is comprised of the S&P Emerging BMI and the S&P Developed BMI. It covers approximately 10,000 companies in 46 countries. To be considered for inclusion in the index, all listed stocks within the constituent country must have a float market capitalization of at least $100 million. For a country to be admitted, it must be politically stable and have legal property rights and procedures, among other criteria.
- The Barclay’s US Aggregate Index, a broad-based unmanaged bond index that is generally considered to be representative of the performance of the investment grade, US dollar-denominated, fixed-rate taxable bond market.
- The Bloomberg Barclay’s US Corporate High Yield Index, which covers the USD-denominated, non-investment grade, fixed-rate, taxable corporate bond market.
An index is a portfolio of specific securities, the performance of which is often used as a benchmark in judging the relative performance to certain asset classes. Index performance used throughout is intended to illustrate historical market trends and performance. Indexes are managed and do not incur investment management fees. An investor is unable to invest in an index. Their performance does not reflect the expenses associated with the management of an actual portfolio. No strategy assures success or protects against loss. There is no guarantee that a diversified portfolio will enhance overall returns or outperform a non-diversified portfolio. Diversification does not protect against market risk. All investing involves risk including loss of principal. Investing in stock includes numerous specific risks including: the fluctuation of dividend, loss of principal, and potential liquidity of the investment in a falling market. Past performance is no guarantee of future results.
Key Indicators
Key Indicators correspond to various macro-economic and rate-related data points that we consider impactful to equity markets.
- The US 10-Year Treasury Yield (%)/bps, is the return on investment for the U.S. government’s 10-year debt obligation and serves as a signal for investor confidence.
- SPDR Gold Trust Price ($), is an investment fund that reflects the performance on the price of a gold bullion, less the Trust’s expenses.
- West Texas Intermediate, which is an oil benchmark and the underlying asset in the New York Mercantile Exchange’s oil futures contract.
- CBOE Volatility Index (Level)/% Change, which uses price options on the S&P 500 to estimate the market's expectation of 30-day volatility.
General Disclosure
Wilbanks, Smith & Thomas Asset Management (WST) is an investment adviser registered under the Investment Advisers Act of 1940. Registration as an investment adviser does not imply any level of skill or training. The information presented in the material is general in nature and is not designed to address your investment objectives, financial situation or particular needs. Prior to making any investment decision, you should assess, or seek advice from a professional regarding whether any particular transaction is relevant or appropriate to your individual circumstances. This material is not intended to replace the advice of a qualified tax advisor, attorney, or accountant. Consultation with the appropriate professional should be done before any financial commitments regarding the issues related to the situation are made.
This document is intended for informational purposes only and should not be otherwise disseminated to other third parties. Past performance or results should not be taken as an indication or guarantee of future performance or results, and no representation or warranty, express or implied is made regarding future performance or results. This document does not constitute an offer to sell, or a solicitation of an offer to purchase, any security, future or other financial instrument or product. This material is proprietary and being provided on a confidential basis, and may not be reproduced, transferred or distributed in any form without prior written permission from WST. WST reserves the right at any time and without notice to change, amend, or cease publication of the information. The information contained herein includes information that has been obtained from third party sources and has not been independently verified. It is made available on an "as is" basis without warranty and does not represent the performance of any specific investment strategy.
Some of the information enclosed may represent opinions of WST and are subject to change from time to time and do not constitute a recommendation to purchase and sale any security nor to engage in any particular investment strategy. The information contained herein has been obtained from sources believed to be reliable but cannot be guaranteed for accuracy.
Besides attributed information, this material is proprietary and may not be reproduced, transferred or distributed in any form without prior written permission from WST. WST reserves the right at any time and without notice to change, amend, or cease publication of the information. This material has been prepared solely for informative purposes. The information contained herein may include information that has been obtained from third party sources and has not been independently verified. It is made available on an “as is” basis without warranty. This document is intended for clients for informational purposes only and should not be otherwise disseminated to other third parties. Past performance or results should not be taken as an indication or guarantee of future performance or results, and no representation or warranty, express or implied is made regarding future performance or results. This document does not constitute an offer to sell, or a solicitation of an offer to purchase, any security, future or other financial instrument or product.