
WST 1Q 2019 Commentary
"Money is like soap. The more you handle it the less you’ll have." - Gene Fama, Nobel Prize-winning economist
"You know what separates the great player from the average player? The average player focuses on the last play. The great player focuses on the next play.” - Mike Krzyzewski, Hall of Fame basketball coach
What a difference a quarter makes! After enduring a 9% slide in December that led to a 14% decline for the fourth quarter, U.S. stocks began 2019 with their best January since 1987 and their best quarter since 2009. The dovish shift in Fed messaging was the most important factor driving the market rebound, but optimism about U.S./China trade talks and an improving outlook for the Chinese economy in general also played central roles. The reemergence of the "Goldilocks” narrative of benign inflation, steady, moderate global economic growth and supportive monetary policy allowed investors to forget, at least temporarily, the terrors that gripped their imaginations in late 2018. Still, as we will discuss below, the rally in risk assets in the first quarter was driven not by the fundamental outlook but by relief that the worst-case scenarios envisioned last year did not play out.
With the immediate threat of a trade war with China averted and fears of an overshoot on tightening by the Fed assuaged, the 20% declines suffered by global stocks last year seemed overdone. Now, with stocks having recouped almost all of last year’s declines, investors face the same questions and risks that emerged in 2018. Global economic growth is slowing as the post-crisis expansion enters its eleventh year, and while central bankers leaned toward looser policies in the first quarter the era of free money is behind us. Any resurgence in inflationary pressures could force the Fed to resume tightening just as growth is slowing. Geopolitical risks have moderated, but the markets continue to await the outcomes of trade negotiations with China and our European counterparts and the resolution of Brexit process. So while the overall tone was positive in the first quarter, the path to high returns for investment assets looks narrower ahead.
In our view the most interesting question raised in the first quarter is how to interpret the mixed signals sent by the surge in stock prices in light of declining global bond yields. Rarely do stocks and bonds rally together as they did last quarter - strong equity performance is historically associated with robust economic and earnings growth. These factors conversely usually drive bond yields higher and steepen the yield curve. Given that norm, the sharp decline in bond yields and the inversion of the U.S. Treasury yield curve during the quarter raised new concerns about the sustainability of the ten-year-old global economic expansion. Should investors take encouragement from the Fed’s shift to a more growth-oriented policy or take heed of its message: that the Fed sees the global economy weakening and the risk of recession increasing? An inversion in the Treasury yield curve, which occurs when long-term interest rates fall below short-term rates, is considered a fairly reliable predictor of a recession — the yield curve has correctly predicted each of the last seven U.S. economic downturns. Importantly, however, the yield curve's ability to predict recessions has not made it a valuable forecasting tool for the stock market. The timing of the onset of recession has ranged from 6 to 24 months after curve inversion, and the S&P 500 continued to grind higher for another 11 months on average before it reached its peak after those signals.[1] So, while the message sent by the bond market so far this year is not encouraging, it doesn’t call for a dramatic tactical portfolio allocation shift. Investor focus will now turn to how and when interest rates normalize, and the ideal scenario would be a "soft landing" with continued moderate growth and low inflation, allowing the Fed to remain on hold and extending the economic expansion through the end of the year.
Economic Overview
Global economic growth slowed in the first quarter and the International Monetary Fund expects weaker growth for 70% of the global economy in 2019, a big change from 2017’s synchronized expansion when every major economy expanded. The backdrop of investor concern about the risk of recession draws into focus three key themes. The first and most important, at least in the short run, is the shift in central bank policy to a more accommodative path in response to the recent softer economic data. Next is the effort by Chinese authorities to cushion China’s slowdown through a mix of monetary, fiscal and regulatory stimulus measures. The health of the Chinese economy is increasingly relevant to the health of the global economy overall. The final area of focus for the markets now is the range of geopolitical risks including trade policy and Brexit.
As we outlined last quarter the key driver of the selloff in risk assets at the end of 2018 was fear that the Fed would overshoot and tighten policy too quickly. The market impact of the December rate hike - the fourth of the year - was exacerbated by Chairman Powell's commentary after the December meeting, when he said the Fed would continue raising rates and shrinking its balance sheet in 2019. At that point investors were already digesting weakening economic data, so Powell's indication that the Fed would remain on "autopilot" in reducing stimulus sent a shudder through the equity markets. This year, with inflation muted and growth slowing, the Fed pivoted to a more gradual path toward policy normalization. Now that the Fed has calmed the markets with its newfound "patience and flexibility in terms of setting policy," we see a risk that investors are unrealistically optimistic about the near-term path of Fed policy in terms of both the Fed funds rate and balance sheet reductions.
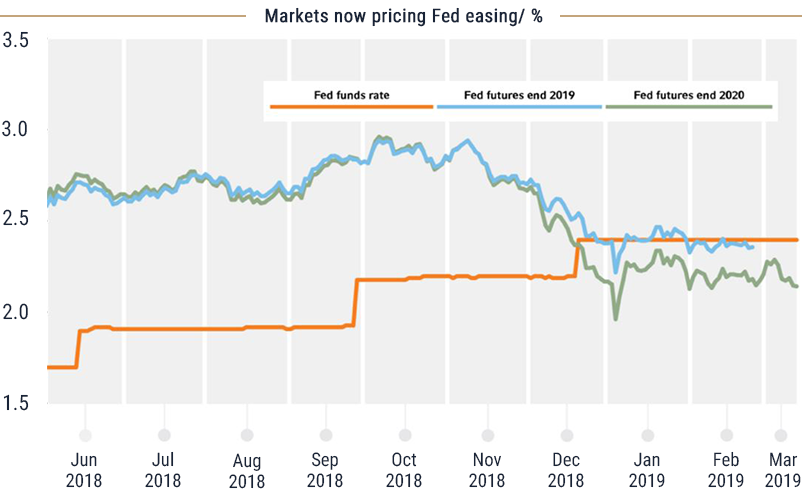
The chart above from Russell Investments reveals the dramatic shift in market expectations about Fed policy in recent months. In November the Fed futures market was predicting three rate increases in 2019. By the end of March it was pricing in a 30% probability of a rate cut by the end of 2019 and a 70% probability of an easing by the end of 2020.[2] Those predictions — i.e., that the Fed funds rate has peaked and the next move will be a rate cut — don't square with the FOMC members’ stated expectations for the future path of interest rates. Recent speeches by committee members and the “Dot Plot” released after the last meeting reveal most Fed committee members still expect rate hikes over the next two years. To the extent that the market may have overreacted to the Fed’s dovish shift, surprises may lie ahead.
Economists seeking to explain the slowdown in global growth last year despite the huge dose of fiscal stimulus injected into the U.S. economy by the Trump tax cuts generally point to the Chinese government's deleveraging campaign and the negative fallout from China's tariff conflict with the U.S. In the fourth quarter concerns about a trade war dampened business confidence and investment globally and hit export-dependent economies like China and the emerging markets particularly hard. UBS makes the case in a detailed report on China published in February that the near-term growth prospects in China have stabilized, and they believe the longer-term outlook is robust. With China expected to overtake the U.S. as the largest economy in the world within a decade, the link between China’s economic health and the global economy as a whole is strong. While the projected 6.1% growth in China's GDP this year and next is lower than the recent trend it still accounts for over 25% of expected global economic growth.[3] The Chinese government is addressing aggressively the headwinds facing their economy through progressive monetary, fiscal and regulatory policies aimed at opening Chinese markets to more overseas investment, increasing consumer demand, and modernizing its industrial infrastructure.
The global trade and geopolitical picture improved a bit in the first quarter but remains an important area of risk for the economy and markets. Trade experts are optimistic that a deal is imminent to defuse the threat of a tariff war with China, and as we write this letter a Chinese delegation led by Vice Premier Liu He is meeting with U.S. officials to hammer out the details. The dynamics of our trade relationship with China will remain a central policy challenge for years to come, but an agreement removing the dark clouds hanging over the trade landscape would be good for sentiment and confidence. Other areas of concern include the discouraging lack of progress in the Brexit negotiations, upcoming elections in the EU and the lead-up to presidential elections in the US in 2020, and the growing concern about the risk of cyber attacks and challenges around data integrity. So, as usual, risks abound.
Equity Market Overview
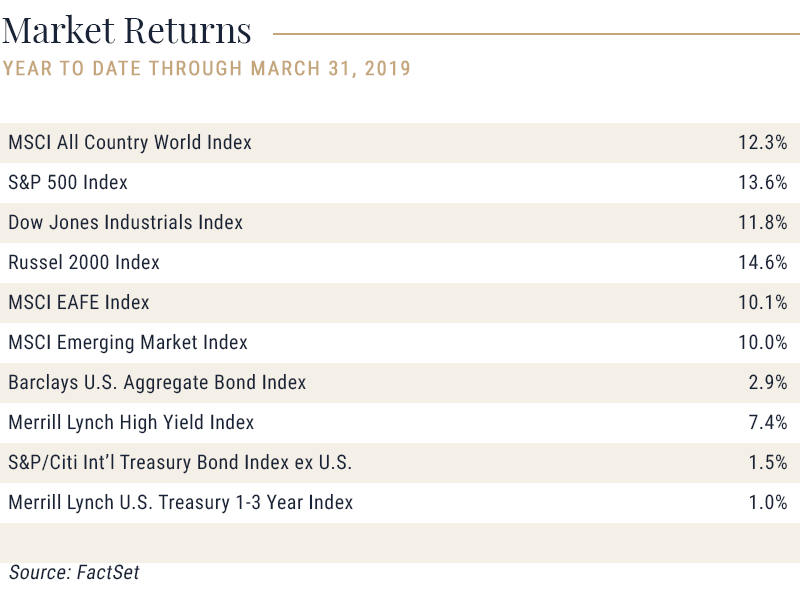
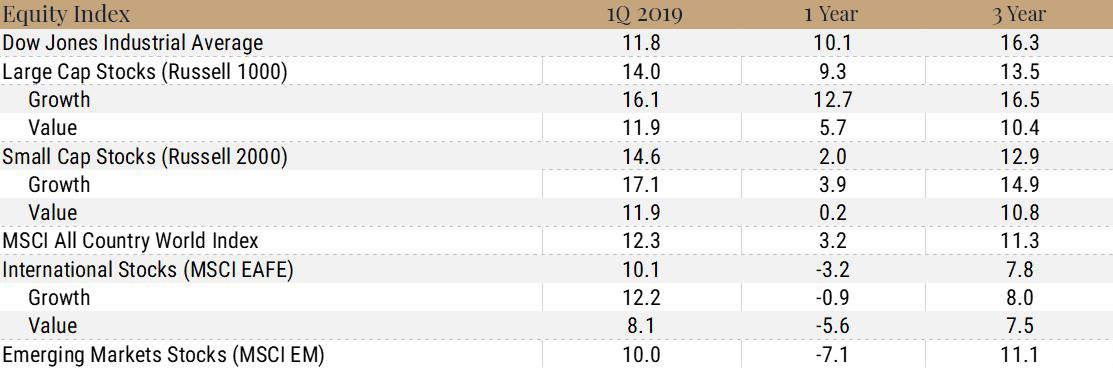
As we mentioned at the outset, this quarter U.S. stocks enjoyed their biggest three-month gain since 2009 and the bull market celebrated its 10th anniversary, making it the longest in history. The newly accommodative tone of central bank guidance this year has fueled the strong rally off the oversold conditions reached at the end of 2018, and with momentum building throughout the quarter the S&P 500 finished with a gain of 13.6%. Small-cap stocks, generally thought to be more sensitive to short-term swings in the economy, were even stronger with the Russell 2000 Index climbing 14.6%. Non-U.S. stocks also performed well with both developed and emerging markets foreign equities climbing 10% for the quarter. The rebound in international equities this year is encouraging after a disappointing 2018, and while they were still unable to keep pace with the momentum in U.S. equities the sentiment around foreign stocks has improved. As the global economic expansion slows the relatively stronger growth outside of the U.S. should continue to support overseas equities. Several of the short-term challenges they faced last year have improved: the Fed’s rate-hike pause should relieve some of the upward pressure on the dollar and foreign equities should take encouragement also from the improvements on the trade front and the more stable situation in China.
Looking forward into the remainder of this year and into 2020 we see the earnings slowdown and relatively high valuations as headwinds for stock prices. With such robust 1Q returns the indexes are well above most of the year-end targets set by analysts in December, and conditions will need to approach perfection for equity investors to enjoy additional large gains this year. 2019 thus far has undermined the axiom in investing that the bond market watches the economy and the stock market watches earnings; while the slowing economy has been priced into the bond market, stock investors seem not to have noticed. Earnings for U.S. companies are already feeling the pressure of the slower economy and, with the effects of last year's tax reform fading, that pressure may increase in coming quarters. The strong job market, while good for the economy as a whole, creates margin pressure for companies as wages rise. Overall revisions to earnings estimates for companies in most sectors have turned negative.
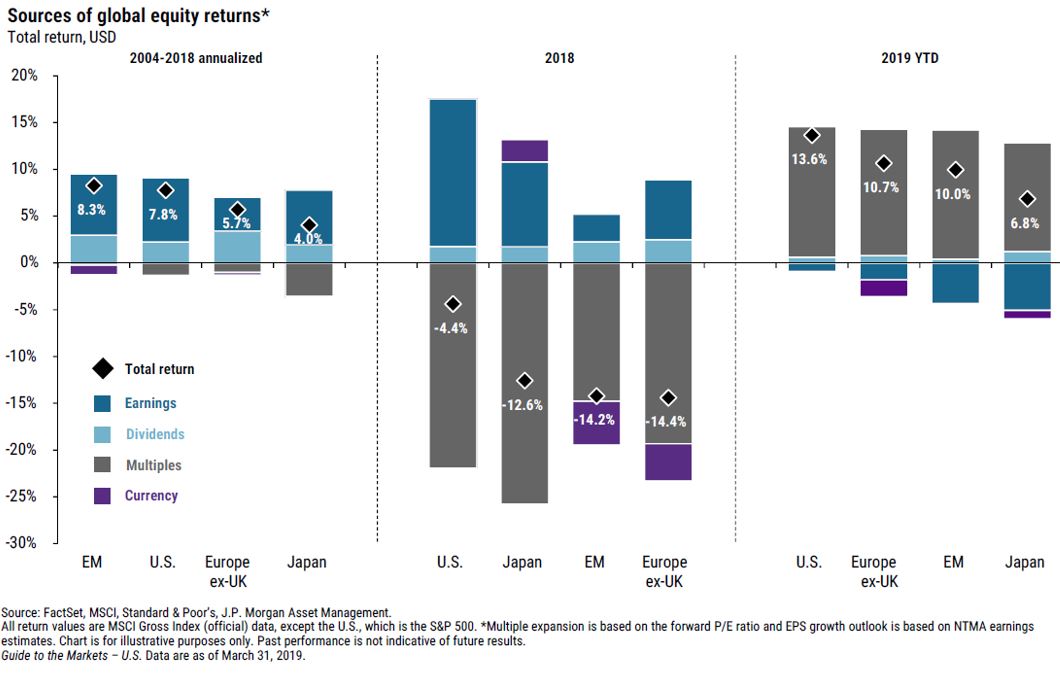
The chart below from J.P. Morgan reveals an important change in stock market dynamics this year as earnings estimates have declined. Stock returns have three main components: earnings growth, changes in the multiple applied to earnings by the market (the P/E ratio), and dividends. Over the long term earnings growth is the main driver, followed by dividends. As the first section of the chart demonstrates those two factors are responsible for all of the market's returns over the past 15 years. In any given year changing investor sentiment may overshadow fundamental corporate performance. For example, in 2018 earnings growth was positive around the world but investors revalued stocks lower as the economic outlook dampened and concerns about central bank policy emerged. The middle section of the chart reveals the S&P 500 declined 4.4% in 2018 despite double-digit earnings growth because the P/E ratio contracted over 20%. The story has flipped in 2019 as investors have overlooked the softer economy and resulting decline in corporate earnings estimates. Stocks have rallied sharply with the S&P 500 up 13.6%, and the entire return has been driven by P/E multiple expansion. Those higher valuations reflect relief that the Fed moderated in response to softer economic data, but we’re doubtful that stocks can rise much more solely on the back of Fed policy. For now the markets are awaiting the corporate earnings season. Investors will be watching the numbers closely but also listening for general signals about the health of the economy and progress in trade talks. With S&P 500 companies expected to report their first year -over-year declines in earnings since 2016 this quarter, the market’s resilience could be tested soon.
Bond Market Overview
Fixed income markets rallied in the first quarter after the Fed and European Central Bank signaled their patience on the path to normalizing global interest rates. Investors snapped up bonds across the duration and credit spectrums while global sovereign bond yields dropped alongside near-term inflation expectations, based on central bankers’ downbeat assessment of U.S. economic growth and weak data on Europe’s manufacturing sector. For much of the quarter conditions seemed "just right" for bond investors as the Fed confirmed its intentions to table near-term rate hikes and the U.S. economy appeared to be running at a pace still healthy enough to support corporate credits. The benign outlook was shaken just after the Fed's March policy meeting, when a batch of economic data out of Europe revealed unexpectedly soft conditions there and sparked renewed concerns about the overall pace of global growth. On that news the 10-Year U.S. Treasury note, which serves as the benchmark rate for consumer loans and mortgages, dipped to 2.4% at the end of the quarter, down over 80 basis points from its recent high of 3.24% in November.
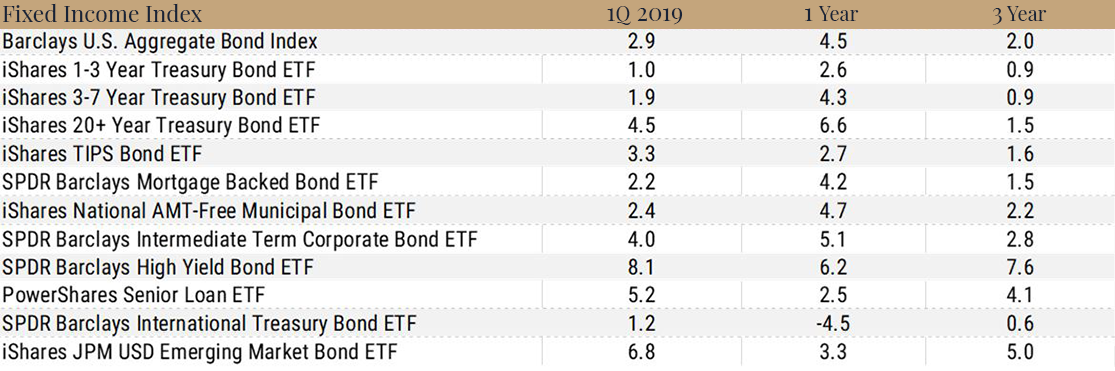
Bond sector performance in the first quarter reflects the same anomaly the stock market does. The sharp drop in Treasury yields over the course of the quarter was in sync with the weaker economic outlook, but the rally in more speculative fixed income segments appears at odds with slower growth. Softening financial conditions would normally lead investors to demand higher returns on riskier assets, but the spread between U.S. Treasuries and more speculative high-yield bonds declined from 5.26% at the end of 2018 to 4.0% at the end of the quarter. As a result the Merrill Lynch High Yield Bond Index generated a total return of 7.4%, outpacing all other segments of the fixed income market, while the overall market as measured by the Barclays U.S. Aggregate Bond index earned a 2.9% total return. As we will discuss below the yield curve flattened and even inverted briefly at the end of March.
The performance conundrum in bonds this quarter reflects a risky reach for income rather than confidence in the underlying credits of bond issuers. With market conditions so favorable borrowers have piled on the debt with increasingly lax credit requirements. According to The Economist about 60% of high yield loans were issued without maintenance covenants in 2018 (covenants require borrowers to maintain certain financial buffers and limit overall indebtedness to protect lenders’ interests) and the overall quality of the U.S. debt market has fallen, with over half of U.S. corporate debt now rated BBB, the lowest investment grade rating. Worriers also point to the growth in the leveraged loan market. Leveraged loans are borrowings arranged by groups of banks and placed directly with lenders who trade them on secondary markets. Concerns about the the growth in leveraged loans focus on the similarities those issues share with the pre-Crisis subprime mortgage market: securitization, deteriorating credit quality and a lack of regulatory oversight.[4] Most leveraged loans are floating-rate issues so the cost of that debt will rise in a rising-rate environment. In the current environment of low interest rates and strong corporate earnings American companies have the wherewithal to service their debt, but the lower credit quality of the new loans made recently exacerbates the risks of a global slowdown. Weaker borrowers would be more vulnerable to short-term cyclicality, so a downturn could lead quickly to cuts in job growth, corporate investment and profitability.
The Yield Curve In Focus
The shape of the yield curve is an esoteric topic that may not be top of mind for the average investor, but as interest rates dropped over the course of the quarter a debate arose around the credentials of the yield curve as a forecaster of recession. Normally the yield curve slopes upward, which means interest rates are higher for long-maturity bonds than for shorter-maturity bonds because investors require more compensation for lending money for longer periods of time. The shape of the yield curve reflects the market expectations about future economic activity; stronger growth portends higher inflation, so the yield curve steepens. Expectations for weaker growth and inflation cause longer-term interest rates to decline and the yield curve to flatten. In extreme cases the curve inverts, as it did in the first quarter. Albeit modest, this inversion was enough to remind many of the last time this shape occurred — in July 2006, just before the Great Financial Crisis.
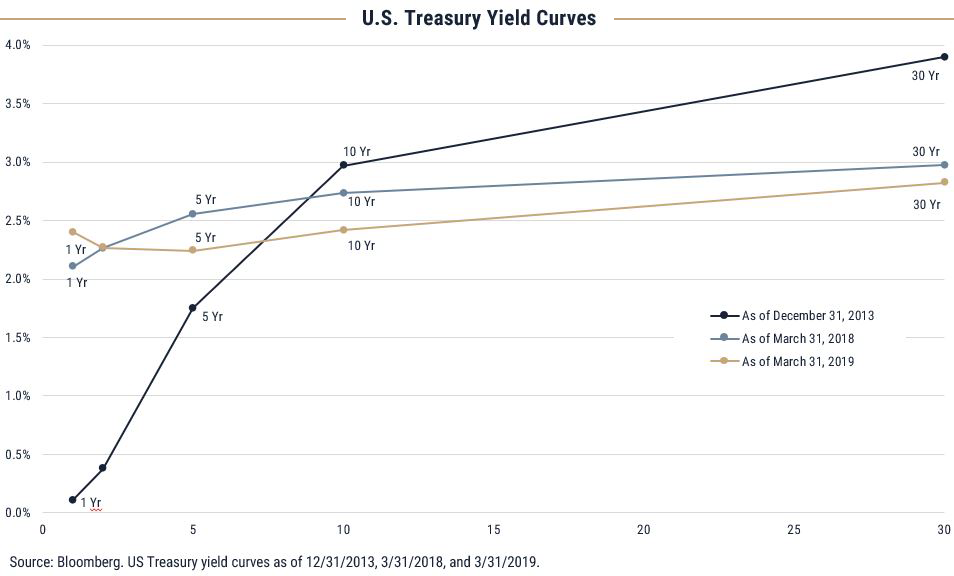
Our view is that comparisons between conditions today and those during previous periods of tightening monetary policy are limited. The brief inversion of the curve in March was driven largely by the lingering, unique conditions created by the Fed after the financial crisis. Today’s rates stand at half the levels seen when the Fed last embarked on a rate-hike cycle. The March announcement of the pause in rate increases was in part due to a cooling of the PCE Price Index from 2.36% in July of 2018 to 1.37% as of January, and it is worth noting the Fed considers a 2.0% change in the PCE Price Index indicative of a neutral policy stance. So, arguably, short rates are too high given current conditions. The flat/inverted yield curve will be resolved one of two ways. If the economy strengthens, long-term yields will rise, but in that environment corporations can continue to grind out higher earnings in support of stock prices. If the economy falters the Fed will cut rates, and the impact on the markets will depend upon the magnitude and duration of the downturn. We’ve seen may instances of a “bad news is good news” reaction to slower growth, where investors cheer weak data that compels the Fed to remain supportive. At this point we remain cautiously optimistic that a modest global expansion may persist on the back of generally favorable economic conditions: strong labor markets, accommodative central bank policies and low inflation. With the Fed on hold for now the most important variable facing the markets is the durability of global growth and the impact on the economy of geopolitical hurdles including Brexit, trade negotiations and the approaching election cycle in the U.S.
Summary
As we heed Coach K’s advice and look ahead to the "next play," our game plan is cautious. The Fed policy shift improved the backdrop for risk assets in the first quarter, but we feel the P/E expansion in US stocks is at or very near its limit in terms of its ability to support higher equity prices. With growth slowing there is significant downside risk to corporate earnings, and the persistent rally across the spectrum of asset classes despite the slowdown in global growth and earnings reflects a disconnect that could unsettle markets. The yield curve inversion in March may not signal an imminent recession but it does suggest that growth is slowing more that than the market expected. With that likelihood priced into Treasury bonds but not stocks or credit, we are on watch for a convergence of views that could drive volatility higher.
Strategist James Paulson summed the situation up well in a recent New York Times article after the quarter: “Everything about this cycle has been weird. If this has the weirdest ending, it shouldn’t shock us. That doesn’t necessarily mean a bear market. What if we have another five years of recovery? There are a lot of different weird ways it could go.”[5]
Our core mandate is to ensure that each portfolio suits the growth objectives, income needs and risk tolerance of the client, and for now our relatively conservative portfolio allocations have us well-positioned to preserve principal but take advantage of volatility. While we, emphatically, offer no pinpoint prediction on the end of this long cycle, we do know that end is inevitable and we believe that even “weird” markets can’t unseat key principles of disciplined planning and portfolio diversification.
Now that the dust is settled on 1Q and market action has made portfolios mostly whole, we wanted to offer an observation from 4Q 2018 that is at essence a bit of praise for our clients. While of course we fielded many calls and market action occasioned some repositioning, as a firm we were impressed by and grateful for the discipline of our clients and partners during a chaotic time for markets. Overall our clients seemed well-prepared for the possibility of a pullback and comfortable with our approach to navigating it; as a result we were positioned to stay the course and see portfolios through the 1Q rebound. The past two quarters have simply deepened our commitment to building trust through communication and we are fortunate to have clients who value this aspect of our approach.
Important Disclosures:
Unless otherwise indicated, performance information for indices, funds and securities as well as various economic data points are sourced from FactSet as of March 31, 2019. This newsletter represents opinions of Wilbanks, Smith and Thomas Asset Management, LLC that are subject to change and do not constitute a recommendation to purchase or sell any security nor to engage in any particular investment strategy. The information contained herein has been obtained from sources believed to be reliable but cannot be guaranteed for accuracy. Some portions of this letter were written in conjunction and collaboration with Capital Markets Consultants Inc. This material is proprietary and being provided on a confidential basis, and may not be reproduced, transferred or distributed in any form without prior written permission from WST. WST reserves the right at any time and without notice to change, amend, or cease publication of the information. This material has been prepared solely for informative purposes. It is made available on an "as-is" basis without warranty. There are no guarantees investment objectives will be met.
This newsletter represents opinions of Wilbanks, Smith and Thomas Asset Management, LLC and are subject to change from time to time, and do not constitute a recommendation to purchase or sell any security nor to engage in any particular investment strategy. This material is proprietary and being provided on a confidential basis, and may not be reproduced, transferred or distributed in any form without prior written permission from WST. WST reserves the right at any time and without notice to change, amend, or cease publication of the information. This material has been prepared solely for informative purposes. The information contained herein includes information that has been obtained from third party sources and has not been independently verified. It is made available on an "as is" basis without warranty. There are no guarantees investment objectives will be met.
The information contained herein has been obtained from sources believed to be reliable but cannot be guaranteed for accuracy.
Market indices are unmanaged and do not reflect the deduction of fees or expenses. You cannot invest directly in an index such as these and the performance of an index does not represent the performance of any specific investment strategy. We consider an index to be a portfolio of securities whose composition and proportions are derived from a rules-based model. Market indices are unmanaged and do not reflect the deduction of fees or expenses. You cannot invest directly in an index such as these and the performance of an index does not represent the performance of any specific investment strategy.
The S&P 500 Index is a market capitalization weighted index, including reinvestment of dividends and capital gains distributions that is generally considered representative of U.S. stock market. The Dow Jones Industrial Average (DJIA) is a price-weighted average of 30 significant stocks traded on the New York Stock Exchange (NYSE) and the NASDAQ. The MSCI ACWI Index is a free float-adjusted market capitalization weighted index that is designed to measure the equity market performance of developed and emerging markets. The MSCI ACWI ex USA Index is designed to provide a broad measure of stock performance throughout the world, with the exception of U.S.-based companies. The MSCI EAFE Index is a stock market index that is designed to measure the equity market performance of developed markets outside of the U.S. & Canada. It is maintained by MSCI Barra, a provider of investment decision support tools; the EAFE acronym stands for Europe, Australasia and Far East. The MSCI Emerging Markets Index captures large and mid cap representation across 24 Emerging Markets (EM) countries. With 845 constituents, the index covers approximately 85% of the free float-adjusted market capitalization in each country. The Russell 2000 index measures the performance of the 2,000 smallest companies in the Russell 3000 index. The Bloomberg Barclays U.S. Aggregate Bond Index covers the USD-denominated, investment-grade, fixed-rate, taxable bond market of SEC-registered securities. The index includes bonds from the Treasury, Government-Related, Corporate, MBS, ABS, and CMBS sectors. The BofA Merrill Lynch U.S. High Yield Index tracks the performance of U.S. dollar denominated below investment grade corporate debt publicly issued in the U.S. domestic market. Qualifying securities must have a below investment grade rating (based on an average of Moody’s, S&P and Fitch), at least 18 months to final maturity at the time of issuance, at least one year remaining term to final maturity as of the rebalancing date, a fixed coupon schedule and a minimum amount outstanding of $250 million. The BofA Merrill Lynch 1-3 US Year Treasury Index is an unmanaged index that tracks the performance of the direct sovereign debt of the U.S. Government having a maturity of at least one year and less than three years. The S&P/Citigroup International Treasury Bond ex-U.S. Index measures the performance of treasury bonds, with maturities greater than or equal to one year, issued by non-U.S. developed market countries.
[1] Robeco Quarterly #11, March 2019
[2] Russell Investments, 2019 Global Market Outlook – Q2 update: The Pause That Refreshes
[3] Taking the Lead – How China Is Driving the Global Economy, UBS, February 2019
[4] https://www.economist.com/briefing/2019/03/14/should-the-world-worry-about-americas-corporate-debt-mountain
[5] De Aenlle, Conrad, “Will Wall Street Lose Faith In Eager To Please Fed?,” The New York Times, April 14, 2019
Besides attributed information, this material is proprietary and may not be reproduced, transferred or distributed in any form without prior written permission from WST. WST reserves the right at any time and without notice to change, amend, or cease publication of the information. This material has been prepared solely for informative purposes. The information contained herein may include information that has been obtained from third party sources and has not been independently verified. It is made available on an “as is” basis without warranty. This document is intended for clients for informational purposes only and should not be otherwise disseminated to other third parties. Past performance or results should not be taken as an indication or guarantee of future performance or results, and no representation or warranty, express or implied is made regarding future performance or results. This document does not constitute an offer to sell, or a solicitation of an offer to purchase, any security, future or other financial instrument or product.