
High Yield: Week in Review
Following a rough week for high yield, we're sharing observations on credit markets and perspective on these concepts in relation to portfolio positioning. Based on conditions discussed below, we believe spread normalization will be expressed in increased credit market volatility, creating both risk and opportunity for high yield investors. Systematic strategies may be best-positioned to maneuver in these markets.
Before the (Potential) Flood: Ballooning Debt & Narrow Spreads
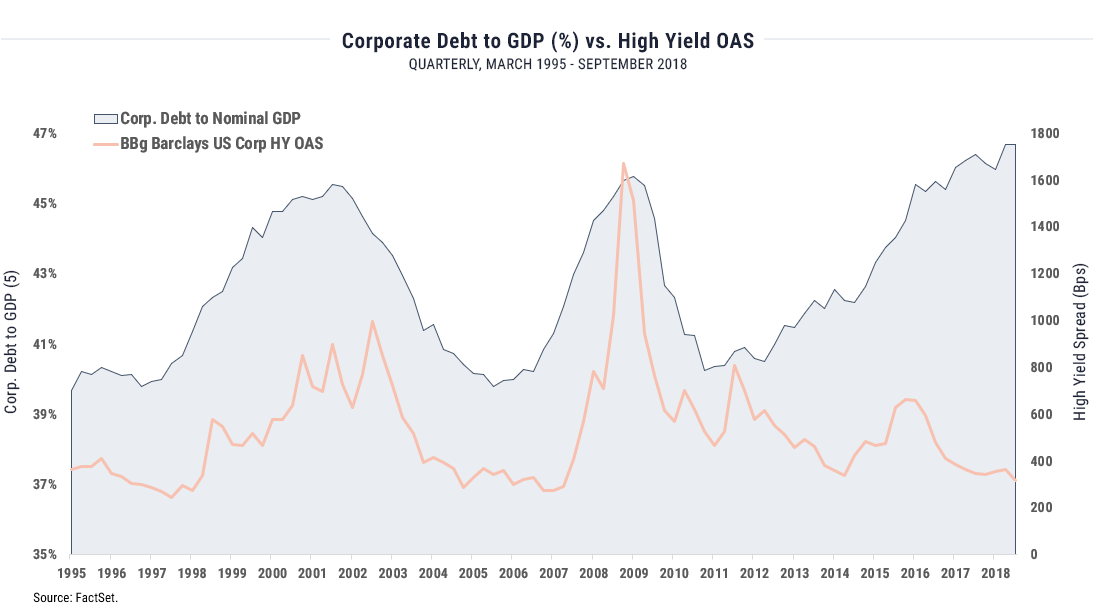
Historically the risk implied by growing corporate debt (expressed below as a percentage of nominal GDP) has been priced into high yield. While debt levels and high yield spreads have moved in tandem for most of the last 25 years, they have seemingly decoupled in the back half of the current cycle. This dislocation is accented in the last few years especially by the acceleration of debt growth versus steady spread-tightening between high yield and the 10-year Treasury.
Importantly, not all investment-grade is equal from a risk perspective and as corporate debt has ballooned so too has the "just-better-than-junk" segment; as of today, the BBB-rated investment grade segment, just one notch above junk, is twice the size of the high yield market. Without attempting to offer any specific prediction we note the possibility that a spate of rating downgrades in that segment could essentially flood the junk market and cause a correction. High yield prices, however, seem not to have registered the risk of such a change in circumstances in the oversupplied bottom tier of the investment-grade universe.
Simply put, while the current high yield market may feel "priced to perfection" and fairly valued in isolation, no bond is an island and we are wary of tangential risks looming within the overall corporate debt market.
Current Risks in Buy-and-Hold Credit Strategies
High yield has vastly outperformed broad fixed income in the low-rate regime of the last few years, beating the US aggregate by around 700 basis points annualized over the last three. Such relative strength may be unsurprising in any equity bull market given high yield's equity-like characteristics, but the asset class has also enjoyed a uniquely strong position in the less-bullish "sideways" environment of 2018.
As we've noted frequently, thanks to its low duration, attractive yield and strong fundamentals, high yield has held up especially well versus US aggregate bonds that have suffered under pressure from rising rates and inflation expectations - global bond markets have done even worse. Short duration/ floating-rate and junk have seemingly offered the only consistent "safety" in the current environment.
That said, in October spreads widened abruptly and high yield (-1.6%) finally gave up the ghost, posting its worst monthly return since December 2015 and reminding investors of the potential for equity-like volatility in the asset class. While high yield remains one of few attractive options in fixed income currently, given the factors described above we believe that now is a critical time to rethink buy-and-hold strategies and consider accessing the asset class opportunistically through tactical frameworks.
The Flipside: Spread Normalization & Opportunity in High Yield
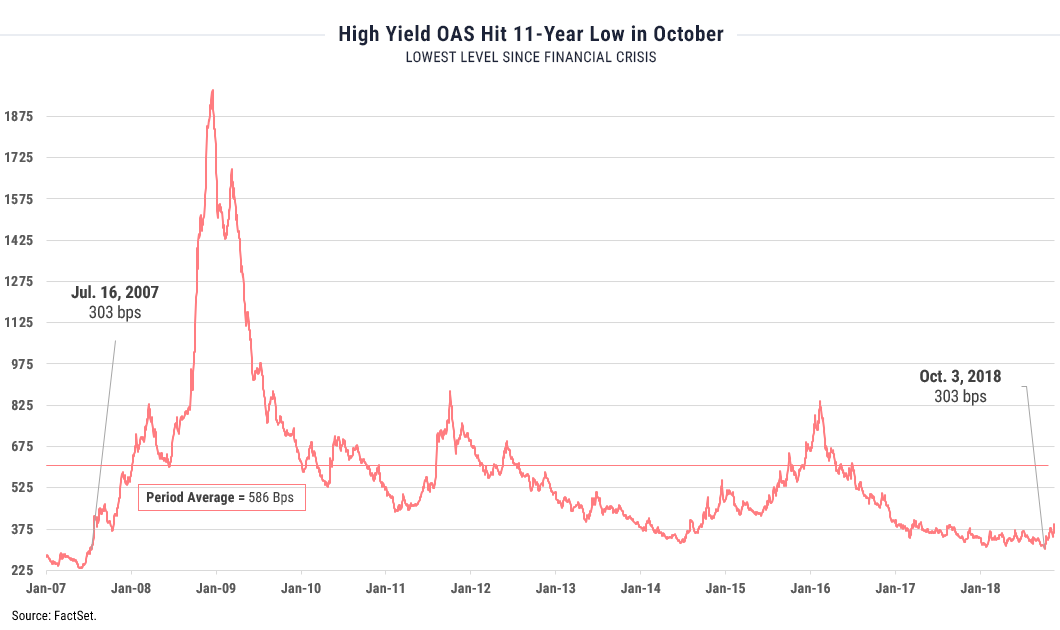
After October's sell-off so far November has offered little relief, as yields have continued to drift upward. As of November 15th spreads had added around 100 basis points off October's 11-year low of 303. Importantly, however, even at 400 basis points today's spread remains well below the 25-year average (540 bps). We believe we are in the early innings of spread normalization that will drive increased credit market volatility, providing entry and exit opportunities and giving oxygen to trend-following approaches that have struggled to deliver in the absence of clear trends.
Based on conditions discussed above, we believe spread normalization will be expressed in increased credit market volatility, creating both risk and opportunity for high yield investors. Systematic strategies may be best-positioned to maneuver in these markets.
For more investment perspectives and market updates, visit the WST blog.
Source: FactSet. Chart 1 shows quarterly corporate debt to GDP %, using nominal GDP and US debt Outstanding by Sector, (Nonfinancial Corporate Business, Debt Securities and Loans, Liability), versus option-adjusted spread to the 10-Year Treasury of the Bloomberg Barclays US Corporate High Yield Index. March 31, 1995-September 30, 2018, using June 2018 (latest available) figure for corporate debt. Chart 2 shows the daily option-adjusted spread for the period January 1, 2007-November 14, 2018.
Besides attributed information, this material is proprietary and may not be reproduced, transferred or distributed in any form without prior written permission from WST. WST reserves the right at any time and without notice to change, amend, or cease publication of the information. This material has been prepared solely for informative purposes. The information contained herein may include information that has been obtained from third party sources and has not been independently verified. It is made available on an “as is” basis without warranty. This document is intended for clients for informational purposes only and should not be otherwise disseminated to other third parties. Past performance or results should not be taken as an indication or guarantee of future performance or results, and no representation or warranty, express or implied is made regarding future performance or results. This document does not constitute an offer to sell, or a solicitation of an offer to purchase, any security, future or other financial instrument or product.